RF Utilities

Hz to PPM Calculator

Frequency accuracy, oscillator tolerance, stability budgets, and clock drift in a single precision RF utility. Convert between Hz, ppm, ppb, and percent at any carrier from 32.768 kHz to 5.8 GHz.

Free forever on a Standard account. No credit card.

Overview

Parts per million is how the industry quotes frequency accuracy, and it is a fraction rather than an absolute. That single fact is the source of most of the confusion around it. A 2 ppm TCXO sounds like a fixed specification, but it is worth 0.065 Hz on a 32.768 kHz watch crystal, 20 Hz on a 10 MHz reference, 290 Hz at 145 MHz, 1.8 kHz at 900 MHz, and 11.6 kHz at 5.8 GHz. The oscillator did not change. The carrier did. Engineers who specify references every week still want a precision tool to remove the conversion as a source of error.

The noIM₃ Hz to PPM Calculator is the precision utility for that work. Enter a nominal frequency in Hz, kHz, MHz, or GHz and convert freely between a frequency error in ppm, the equivalent offset in Hz, the frequency a counter would actually read, and the same error expressed in ppb and percent. Every field is bidirectional and updates live, so the tool works equally well from a datasheet figure forwards or from a bench measurement backwards. Conversions follow the standard relationships exactly (ppm equals Δf divided by f₀ times 10⁶) rather than rounding, and offsets render from microhertz to megahertz so the answer is readable at any carrier.

Beyond raw conversion, the calculator handles the three jobs that surround it. A datasheet plus or minus ppm tolerance becomes the allowed frequency window at your carrier, with the minimum, maximum, and total peak to peak width. An oscillator stability budget totals the contributions two ways, worst case and RSS, so you can see both the bound your specification has to respect and the statistical combination, and decide which one is defensible. Finally, because a clock derived from a reference inherits its fractional error exactly, the same ppm figure is read as accumulated time error: 1 ppm is exactly 1 µs/s, 86.4 ms per day, and 31.536 s per year.

Capabilities

Bidirectional Hz to ppm conversion

Convert freely between a frequency error in ppm, the offset in Hz, ppb, and percent at any nominal frequency from sub Hz to tens of GHz. Every field updates the others live. Changing the nominal frequency holds the ppm and recomputes the Hz, because the headline question is what a given ppm is worth at your carrier.

Measured frequency worked backwards

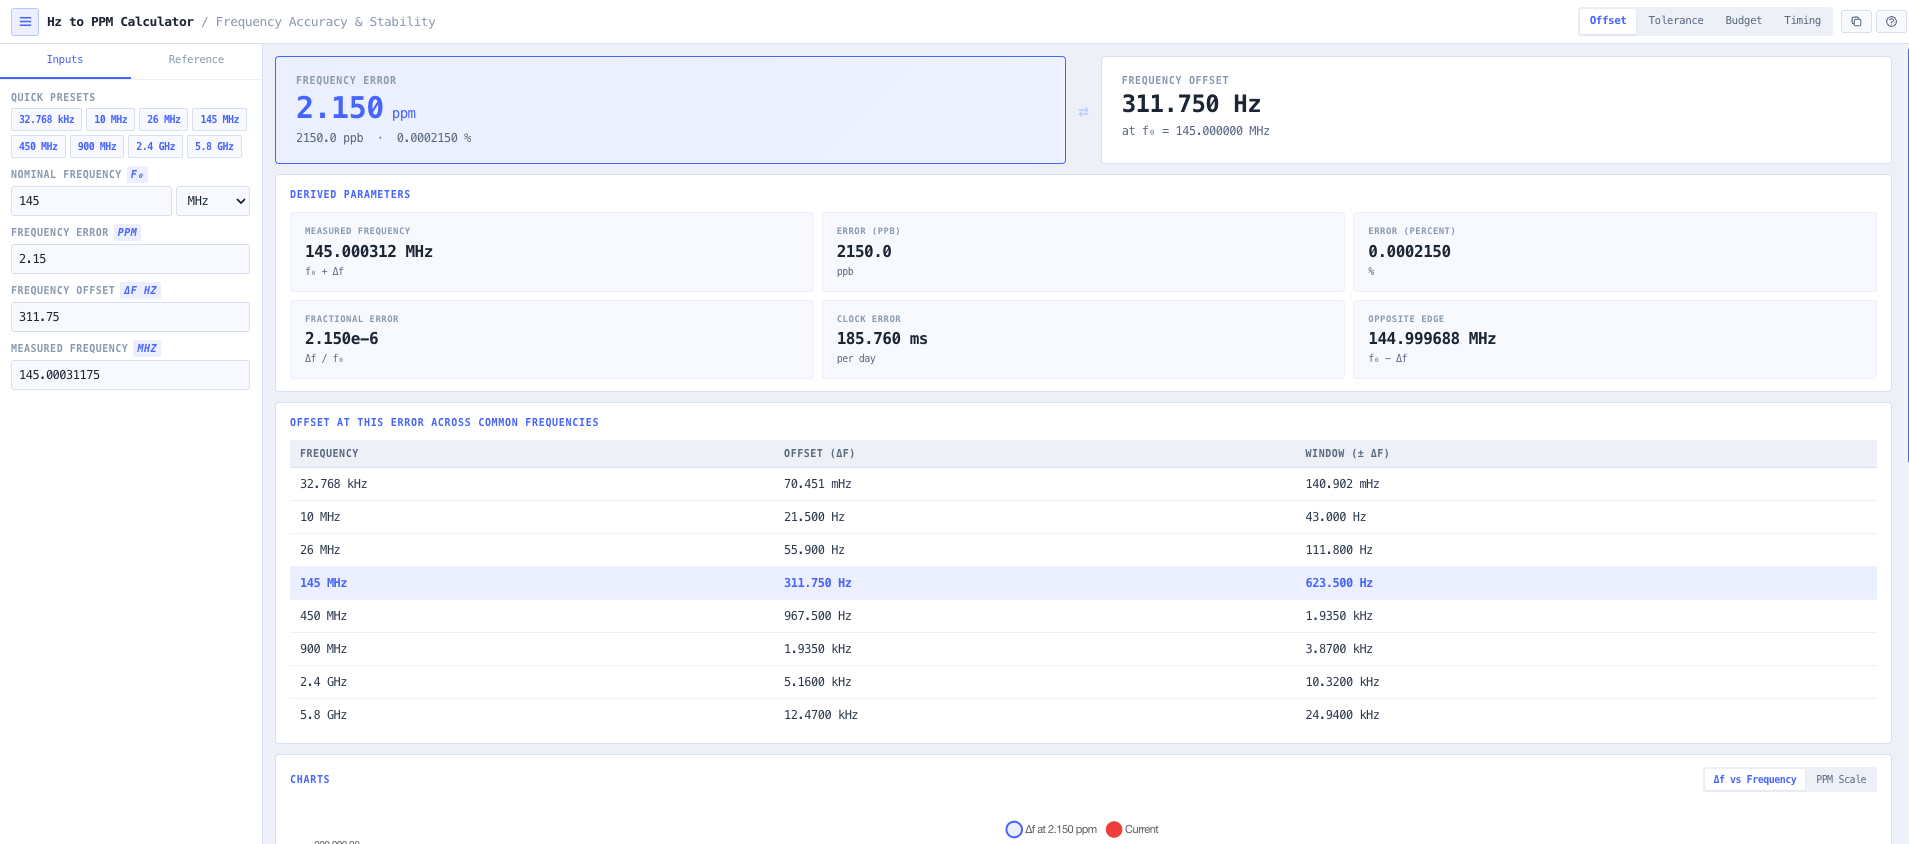
Enter the frequency a counter actually read and the tool works the conversion backwards to the ppm error against nominal. A counter on a 145 MHz transmitter reading 145.000312 MHz is 2.15 ppm high. This is the real bench workflow, and it is a first class input rather than something you reach by rearranging the formula yourself.

Tolerance to frequency window

Turn a datasheet plus or minus ppm tolerance into the allowed frequency window at your carrier: the plus or minus offset in Hz, the minimum frequency, the maximum frequency, and the total peak to peak width. The tolerance is treated as symmetric so its sign is ignored. Eight presets seed the common datasheet grades from plus or minus 0.1 ppm through plus or minus 50 ppm.

Stability budget, worst case and RSS

Build an oscillator stability budget from addable, renameable contributions covering initial accuracy, temperature stability, ageing, and supply and load pull. Both totals are reported side by side. Worst case sums the magnitudes and bounds the specification. RSS combines independent terms statistically and is always the smaller number. The dominant contribution and its share are called out so you know which term to attack.

Frequency error read as clock drift

A clock derived from a reference inherits its fractional error exactly, so a frequency offset is also a time error. Convert ppm into accumulated drift per second, hour, day, and year, size the drift over an arbitrary holdover period, and find how long a reference holds before it passes a 1 ms or 1 s target from the last sync.

Carrier dependence made explicit

Each mode reports a table of what the current error or tolerance is worth at every common frequency from 32.768 kHz through 10 MHz, 145 MHz, and 900 MHz to 5.8 GHz, alongside a chart of offset against frequency across the whole 10 kHz to 10 GHz span on log axes. The fractional nature of ppm stops being an abstraction.

Indicative oscillator grade references

Built in reference ranges for each oscillator technology class (XO crystal, VCXO, TCXO, OCXO, rubidium, and GPS disciplined) place a quoted figure against the technology it implies, and report what each grade is worth in Hz at your carrier and in clock error per day. These are ballpark ranges for orientation only, not a specification, and no substitute for the datasheet of the actual part.

Browser only computation

Runs entirely in your browser. No frequencies, tolerances, or stability budgets are submitted to a server. Useful for commercially confidential work, classified projects, or any environment where information security policy prohibits sending engineering data to third party services.

Standards & methodology

  • ppm defined as the fractional frequency error Δf divided by f₀, scaled by 10⁶
  • Fractional frequency error carried directly into time error, where 1 ppm equals 1 µs/s
  • Ordinary 365 day year (31,536,000 s) for per year ageing and drift figures
  • Worst case totalling as the arithmetic sum of contribution magnitudes
  • RSS totalling as the root sum square of independent contributions

When to use this tool

  • Converting an oscillator datasheet plus or minus ppm tolerance into the frequency window at your carrier
  • Working a bench counter reading backwards to the ppm error against nominal
  • Checking what a TCXO or OCXO grade is worth in Hz before committing to a reference
  • Totalling an oscillator stability budget across initial accuracy, temperature, ageing, and pulling
  • Deciding whether a worst case or an RSS total is the defensible number for a specification
  • Sizing the holdover drift of a reference over a known outage period
  • Finding how long a clock holds before it drifts past a 1 ms sync target
  • Comparing the frequency error of the same oscillator grade across VHF, UHF, and microwave carriers
  • Translating a frequency error between ppm, ppb, and percent for an engineering report
  • Sanity checking a quoted stability figure against the oscillator technology it implies
  • Estimating the cumulative ageing contribution over a ten year service life
  • Teaching why a fractional frequency error scales with the carrier in RF engineering training

Is this the right tool for you?

Reach for the Hz to PPM Calculator in any of the following situations.

  • You are choosing between a 2 ppm TCXO and a 0.05 ppm OCXO for a 5.8 GHz radio and need to see what each is worth in Hz at that carrier before the cost conversation.
  • You have a counter on a transmitter reading 145.000312 MHz against a 145 MHz nominal and want the error in ppm rather than reaching for the formula.
  • You are reading an oscillator datasheet that quotes plus or minus 2.5 ppm and need the actual frequency window that allows at your operating carrier.
  • You are writing a stability specification and need to know whether the worst case sum or the RSS of your contributions is the number you can defend.
  • You are sizing a reference for a site that loses GPS lock for days at a time and need the accumulated drift over the holdover period.
  • You are troubleshooting a link that fails after hours of uptime and want to know whether the reference could plausibly have drifted past the receiver pull in range.
  • You are specifying an oscillator for a ten year service life and need the cumulative ageing contribution added to the initial accuracy and temperature terms.
  • You need to convert a stability figure quoted in ppb on one datasheet to the ppm used on another so the two parts can be compared like for like.
  • You are estimating how long a free running clock holds sync before it drifts past a 1 ms timing budget.
  • You are checking whether a quoted 0.001 ppm figure is plausible for the technology the vendor claims to be using.
  • You are training new RF engineers and want a tool that makes the carrier dependence of ppm visible rather than asserted.
  • You are producing a frequency accuracy table for an engineering report and want the same error expressed in Hz, ppm, ppb, and percent consistently.
  • You are operating under a security regime that prohibits sending design data to third party services and need a calculator that runs entirely in your browser.

Frequently asked questions

How do I convert Hz to ppm?

Divide the frequency offset by the nominal frequency and multiply by a million. ppm equals Δf divided by f₀ times 10⁶. A 290 Hz offset on a 145 MHz carrier is 290 divided by 145,000,000 times 10⁶, which is 2 ppm. Going the other way, Δf equals ppm times f₀ divided by 10⁶. The calculator does both directions live and exactly, so the output preserves enough significant figures for engineering documentation.

Why is the same ppm figure a different number of Hz at every frequency?

Because ppm is a fraction, not an absolute. It expresses the error as a proportion of the carrier, so the Hz it represents scales directly with the carrier. A 2 ppm oscillator is 0.065 Hz on a 32.768 kHz watch crystal and 11.6 kHz at 5.8 GHz. Same specification, same part, a difference of more than five orders of magnitude in Hz. This is why a tolerance that is comfortable at VHF can be unworkable at microwave, and it is the single most common source of surprise when a design moves up in frequency.

What is the difference between ppm, ppb, and percent?

They are the same fractional error at different scales. ppb equals ppm times 1000, so 0.001 ppm is 1 ppb. Percent equals ppm divided by 10,000, so 10,000 ppm is 1 percent. ppm suits crystal and TCXO work, ppb suits OCXO and rubidium work where ppm figures get uncomfortably small, and percent almost never appears in frequency work but does turn up when a specification has been written by someone outside the discipline. The calculator surfaces all three at once so the conversion is a read across.

Should I use the worst case or the RSS total for a stability budget?

It depends on what the number is for. Worst case sums the magnitudes of every contribution and assumes each lands at its specification limit, in the same direction, at the same time. It is pessimistic, and it is the bound a datasheet total stability figure has to respect. RSS takes the root sum square, which assumes the contributions are independent and treats each as a statistical spread rather than a hard limit, so it is always the smaller number. RSS is only valid when the terms genuinely are independent. An ageing trend and a temperature ramp both pulling the same way are correlated and do not qualify. The calculator reports both and does not pick for you.

How does a frequency error become a clock error?

A clock derived from a reference inherits its fractional error exactly, so the two are the same number wearing different units. 1 ppm is exactly 1 µs per second by definition, which works out to 86.4 ms per day and 31.536 s per year on an ordinary 365 day year. A 50 ppm uncompensated crystal drifts about 4.3 s per day, which is why a cheap digital clock needs resetting. A 0.05 ppm OCXO drifts about 4.3 ms per day. The Timing mode makes this conversion directly and also answers the operational question, which is how long you hold before you pass a target.

How is ageing handled?

Cumulative ageing is the quoted per year rate multiplied by the number of years, which is a linear extrapolation. Real crystal ageing is steepest in the first months after manufacture and flattens towards a logarithmic trend, so a linear projection over a long service life is a conservative bound rather than a prediction. It will overstate the drift, not understate it, which is the right direction for a specification. The default budget carries ageing as an explicit named row so the service life assumption stays visible rather than disappearing into a single total.

Where do the oscillator grade figures come from?

They are indicative ranges for each oscillator technology class, offered so a quoted figure can be placed against the technology it implies. They are not a specification, they are not drawn from any regulatory instrument, and they are not a substitute for the datasheet of the part you are actually specifying. Real parts vary widely inside each class, and vendors quote stability over different conditions. Use the grades for orientation and the datasheet for decisions.

Does any data leave my browser?

No. The calculator runs entirely in your browser. No frequencies, tolerances, or stability budgets are submitted to a server. Useful for commercially confidential work, classified projects, or environments where information security policy prohibits sending engineering data to third party services.