Distributed Antenna Systems

In-building DAS Designer

Passive distributed antenna system design on real floor plans, with per band link budgets, derived cable schedules and indoor coverage prediction to ITU-R P.1238.

Overview

A passive distributed antenna system is a simple thing to describe and an easy thing to get wrong. Coax leaves a head end, passes through splitters and couplers, and ends at antennas spread through a building. Every one of those elements takes a bite out of the budget, the bites change size with frequency, and the cable lengths that dominate the total are set by a route through the building that a schematic cannot see. Spreadsheets handle the arithmetic and lose the geometry. This tool keeps both.

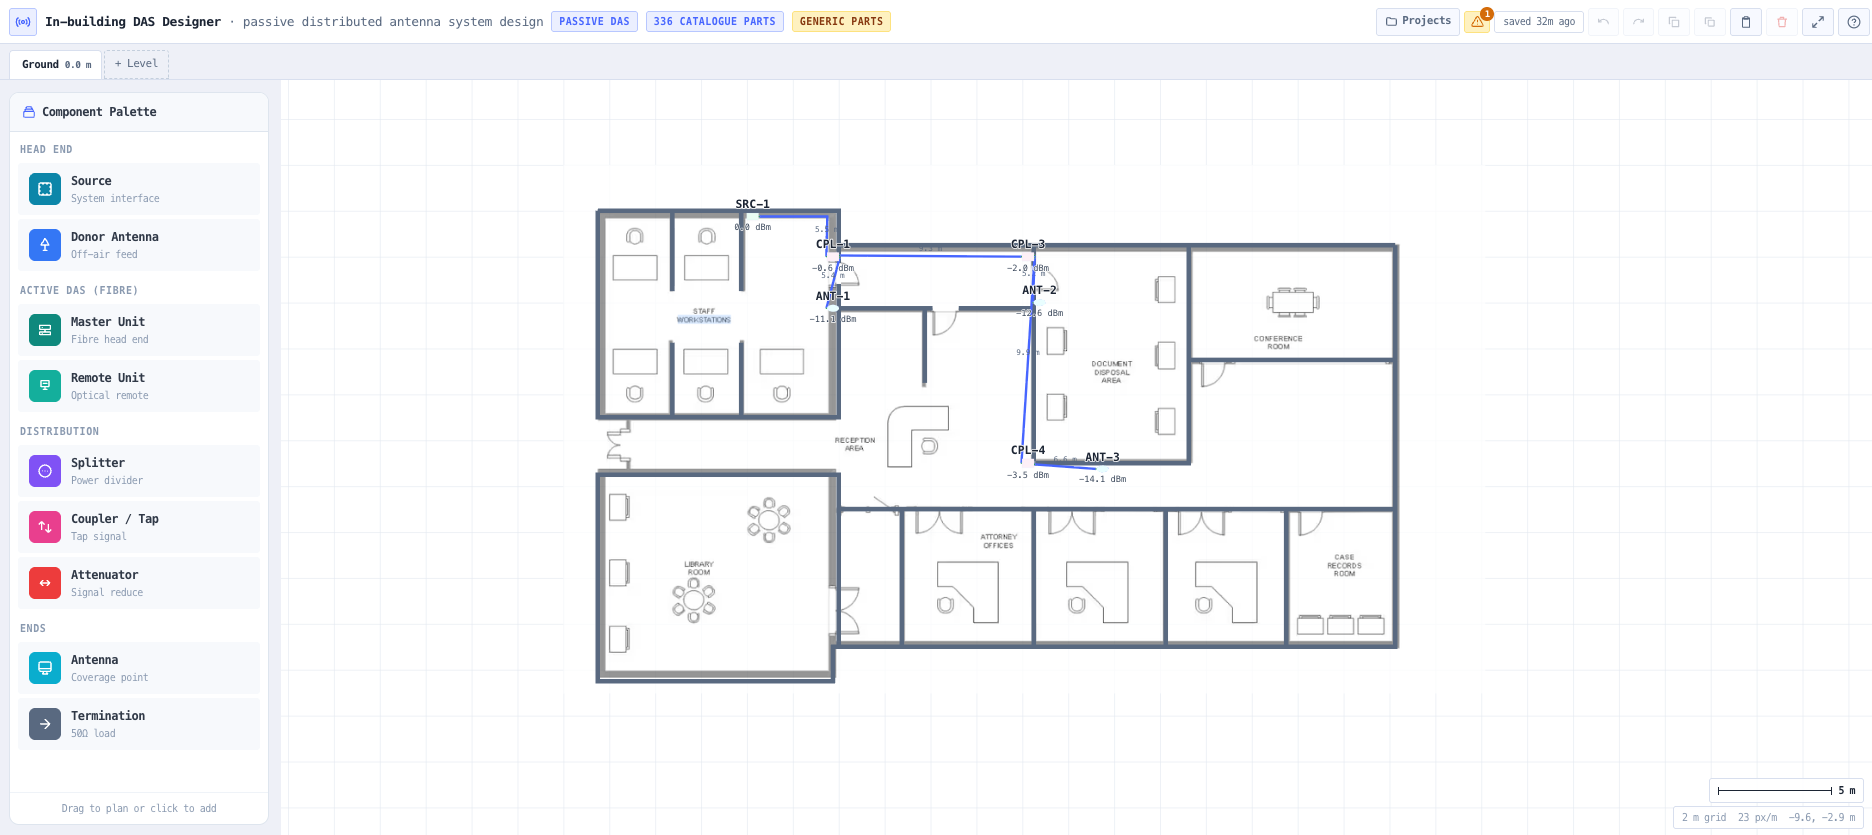
Design happens on the floor plan. Import a plan image for each level, set its scale by clicking two points a known distance apart, and place equipment at real metre coordinates. Run lengths then derive from the layout, including the vertical component when a run climbs a riser between levels, with a slack allowance you control for dressing and service loops and a measured length override for the runs where someone has already been on site with a tape. Cable length and propagation distance are treated as the different quantities they are: a cable follows the building, across and then up, while a radio path takes the straight line, so the tool never quietly uses one where the other belongs.

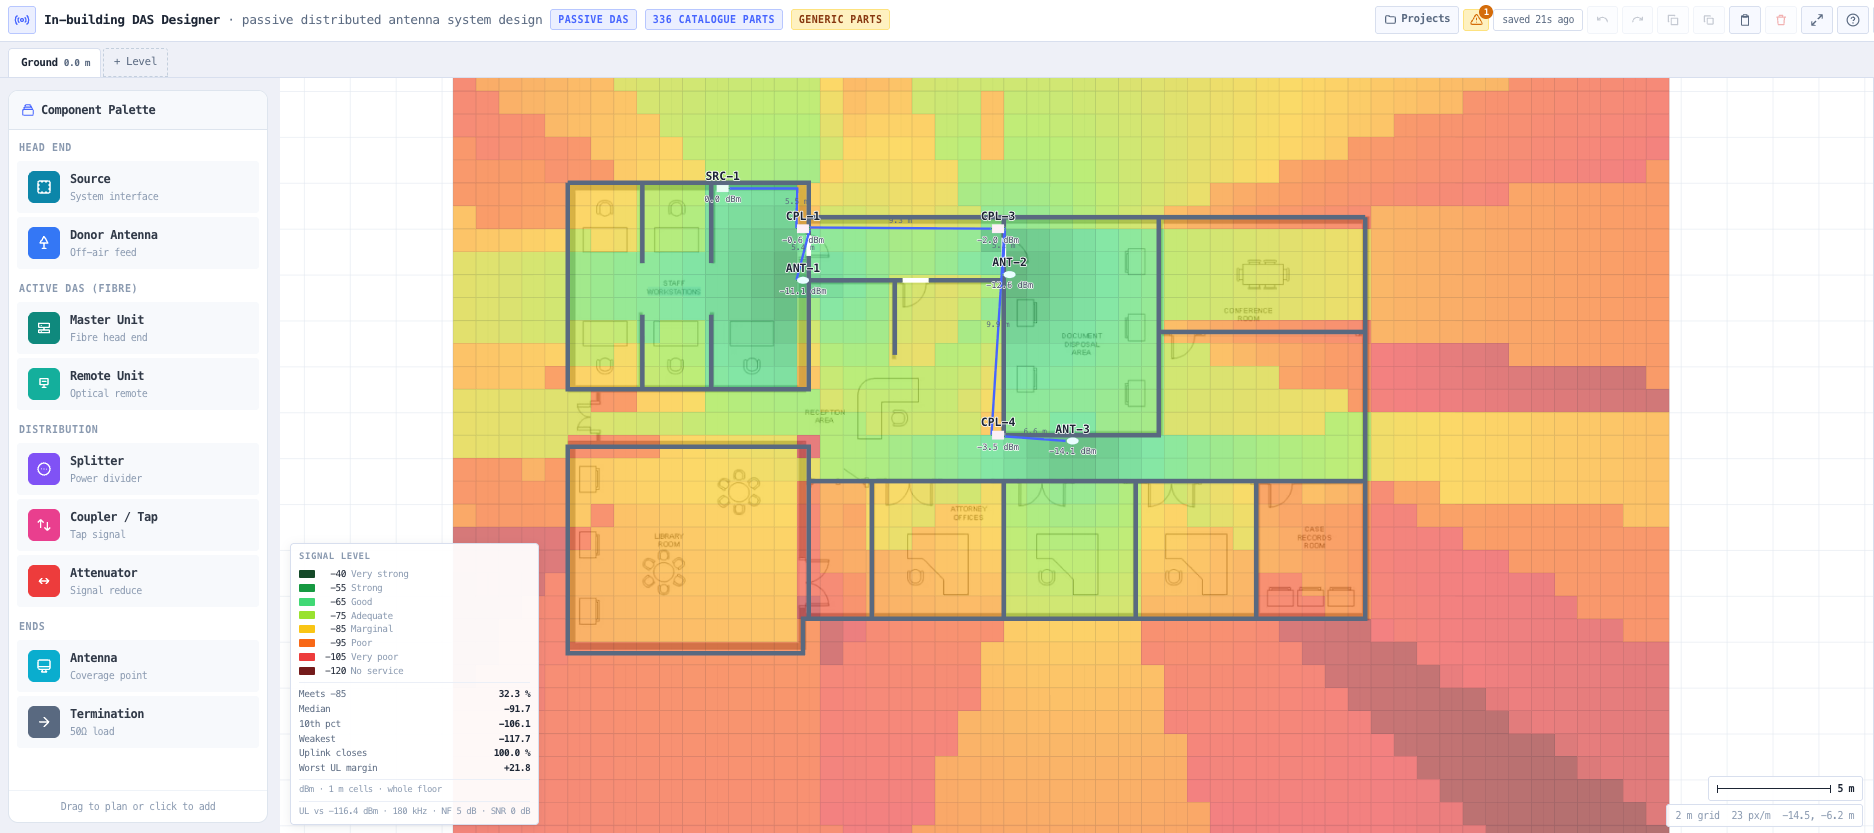
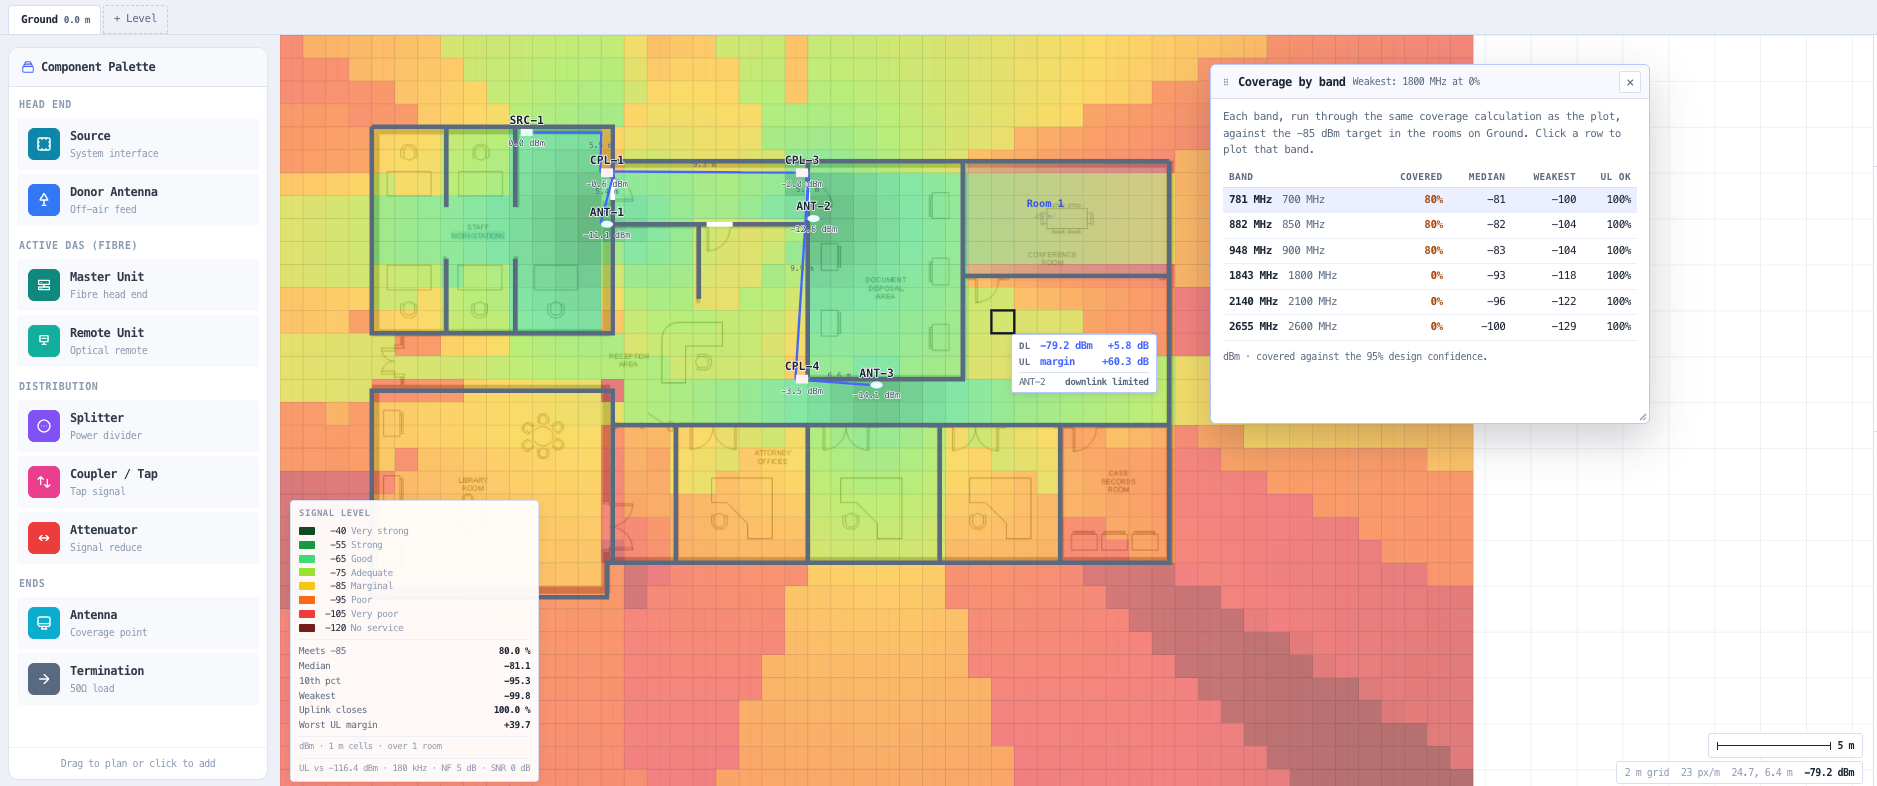
The link budget runs once for every band you enable, because there is no single answer across a band plan. Cable loss roughly doubles between 700 MHz and 2.6 GHz, passive loss moves with frequency, and a wideband indoor antenna does not have one gain figure across its range. The result is the power at every node and the EIRP at every antenna, with the loss broken into its cable, passive and connector parts so a number can be argued with rather than just accepted. Coverage is then predicted with the ITU-R P.1238-13 site general model and drawn as a best serving antenna heat map for the level and band you are looking at.

Capabilities

Scale calibrated multi level plans

Each level carries its own floor plan raster and its own two point scale calibration: click two points whose real separation you know, type the distance, and the plan is registered. Equipment is stored in metres rather than pixels, so recalibrating a plan rescales the backdrop without moving the design in the building.

Cable schedules derived from the layout

Run lengths come from the routed geometry rather than being typed in. Waypoints let you route around a core or along a tray, a run between levels picks up the vertical distance automatically, and a slack allowance covers dressing and service loops. A measured length taken on site overrides the derived figure and suppresses slack, because a real measurement already contains it.

Per band link budget

The cascade runs independently for every enabled band. Power is reported at every node and EIRP at every antenna, with loss split into cable, passive and connector contributions that reconcile exactly against the drop. A default Australian band plan covering 700 MHz through 2600 MHz is included and fully editable.

Indoor coverage to ITU-R P.1238-13

Coverage uses the site general model from the current edition of the Recommendation, across the four environments it publishes coefficients for, with a line of sight setting and a log normal shadow fading margin at the confidence you choose. The tool says plainly when a predicted design radius runs past the distance range the Recommendation fitted that environment over, instead of presenting an extrapolation as a design figure.

Best serving antenna heat map

Coverage is drawn per level and per band as the strongest single antenna at each point. Every antenna in a passive DAS radiates the same signal from the same head end, so summing their powers would overstate the level and treating them as interferers would understate it. Best server is the standard in-building convention and is conservative where footprints overlap.

Validation that refuses to guess

Structural problems are reported rather than computed around: a component fed by more than one run, a run leaving a port that does not exist, two runs on one port, a loop in the network, an unterminated port, or an antenna that does not cover the band it is carrying. A head end with no composite power entered for a band is an error, not a default, because an assumed power produces a budget that looks right and is not.

Provenance on every component

Each part carries a badge saying where its numbers came from: a manufacturer datasheet, a vendor design library, a value derived from physical law such as the ten log N split loss of a divider, or a generic planning part. A design therefore states which of its figures are backed by a datasheet and which are not.

Head end options

Model the source as an off air bi-directional amplifier, a carrier supplied small cell, an on site land mobile repeater for public safety and site radio, or a user defined fixed source when the head end is out of scope.

Standards & methodology

  • ITU-R P.1238-13 site general indoor basic transmission loss, sections 3.1 and Table 2
  • ITU-R P.341-7 basic transmission loss definitions
  • Conservation of power for ideal splitter and directional coupler losses

When to use this tool

  • Designing in-building carrier coverage for an office tower, hospital or shopping centre
  • Sizing a public safety or land mobile radio in-building system fed from an on site repeater
  • Producing a cable schedule and bill of materials from a floor plan rather than a spreadsheet
  • Checking whether an existing passive DAS still meets a target level once a band is added
  • Comparing splitter tree against tapped riser architectures for the same building

Frequently asked questions

Why does the link budget run separately for every band?

Because cable loss, passive loss and antenna gain all change with frequency. Over a typical main run, cable loss roughly doubles between 700 MHz and 2.6 GHz, and a wideband indoor antenna does not have a single gain figure across its range. A single frequency cascade is therefore wrong by several decibels at one end of a real band plan or the other.

How accurate is the coverage prediction?

It is planning grade. The ITU-R P.1238-13 site general model is an empirical fit with a published shadow fading standard deviation, and the tool applies that as a margin at your chosen confidence. The model is fitted over a stated distance range per environment, and where a prediction runs past that range the tool says so rather than presenting the number as a design figure. It is not a ray tracing tool and does not model individual walls.

Does it predict coverage between floors?

No. Only antennas on a level serve that level. Through floor prediction needs the site specific model and its floor penetration factors, which the Recommendation publishes largely at frequencies well above the cellular bands, so predicting it here would mean inventing numbers. A DAS is designed with antennas on the floor they serve in any case.

Can I design without a floor plan?

Yes. Equipment still sits at real coordinates and run lengths still derive from the geometry. The floor plan is a backdrop that makes placing equipment accurate and meaningful, not a requirement.

Where do the component figures come from?

Every part carries a provenance badge. Splitter and coupler losses are derived from conservation of power plus a stated excess allowance, which is why an ideal two way splitter can never better 3.01 dB. Cable attenuation for the generic size classes is solved through published anchor points. Parts drawn from a manufacturer datasheet or a vendor design library are badged as such, so a design always states which of its numbers are datasheet backed.

Does it handle active DAS or fibre fed remotes?

Not in this version. The tool models a passive network of coax and passives fed from a single head end per branch, which is where the loss budget and the cable schedule are the design problem. An active or hybrid system with fibre fed remote units has a different budget structure.