Private Cellular

LTE Throughput & Resource Grid Calculator

Spec exact LTE throughput read from the 3GPP TS 36.213 transport block size table, with the resource grid counted channel by channel from TS 36.211 and an effective code rate check that refuses to report a rate the grid cannot carry.

Free forever on a Standard account. No credit card.

Overview

Most LTE throughput calculators multiply a modulation order by a bandwidth, subtract a round number for overhead, and print a peak rate that no network has ever delivered. This one does not model LTE. It looks the answer up, in the same table the base station uses.

Pick a channel bandwidth and the transmission bandwidth configuration follows from TS 36.101 Table 5.6-1. Pick an MCS and the modulation order and the transport block size index follow from TS 36.213. The transport block size itself is a lookup against the resource blocks actually allocated. Multiply by the spatial layers, count the subframes that carry your direction, and that is the throughput. The resource element count never enters it, because an eNB does not derive a transport block size from a grid, it reads one.

The grid is then counted independently and used to check the answer. Every resource element in the subframe is accounted for: the control region across the carrier, cell specific reference signals counted only outside that region so nothing is charged twice, and the synchronisation and broadcast channels averaged over the frame because they recur every 10 ms rather than every subframe. What is left is what the shared data channel has to work with, and the transport block has to fit inside it.

The two halves meet at the effective code rate: the transport block plus its 24 bit CRC, over the data resource elements times the bits per symbol. A combination whose code rate exceeds one is asking for more bits than the grid has room to carry and cannot be transmitted at all. Above about 0.93 it will not decode in practice. A tool that only reads the table will report both as throughput.

Capabilities

Transport block sizes from the specification, all 4840 of them

TS 36.213 Table 7.1.7.2.1-1 is extracted in full rather than approximated by a formula, because the table is not a smooth function and the gaps in it are real. The number reported is the number of bits the base station puts on the air in that subframe.

The grid is counted, not estimated as a percentage

Overhead is itemised by channel from TS 36.211 rather than lumped into a flat figure. The control region takes its one to three OFDM symbols across the carrier, reference signals are counted per antenna port, and the synchronisation and broadcast channels are charged to the frame rather than to every subframe.

Reference signals counted only outside the control region

Reference signals inside the control region are already paid for by the control symbols. Counting them a second time is a common error and an invisible one, because it produces a plausible number that is simply low. They are counted once here.

FDD and TDD with all seven uplink downlink configurations

TDD throughput depends entirely on which subframes carry your direction, and the seven configurations in Table 4.2-2 range from two uplink subframes in ten to six. The subframe pattern is applied rather than assumed.

The effective code rate check

The one number that connects the table lookup to the grid. Above one the combination is unschedulable, and above roughly 0.93 it will not decode. Both are reported rather than quietly passed through as throughput, which is what a pure table lookup does.

Reserved MCS values reported as reserved

MCS 29 to 31 carry no transport block size, because they signal a retransmission. They are reported as reserved rather than as a rate, which is what an interpolating calculator produces for them.

Uplink uses the uplink table

The MCS to transport block size index mapping is not the same in both directions, and the column that carries it differs between Table 7.1.7.1-1 and Table 8.6.1-1. Each direction reads its own.

PUCCH caps the uplink allocation rather than hiding inside it

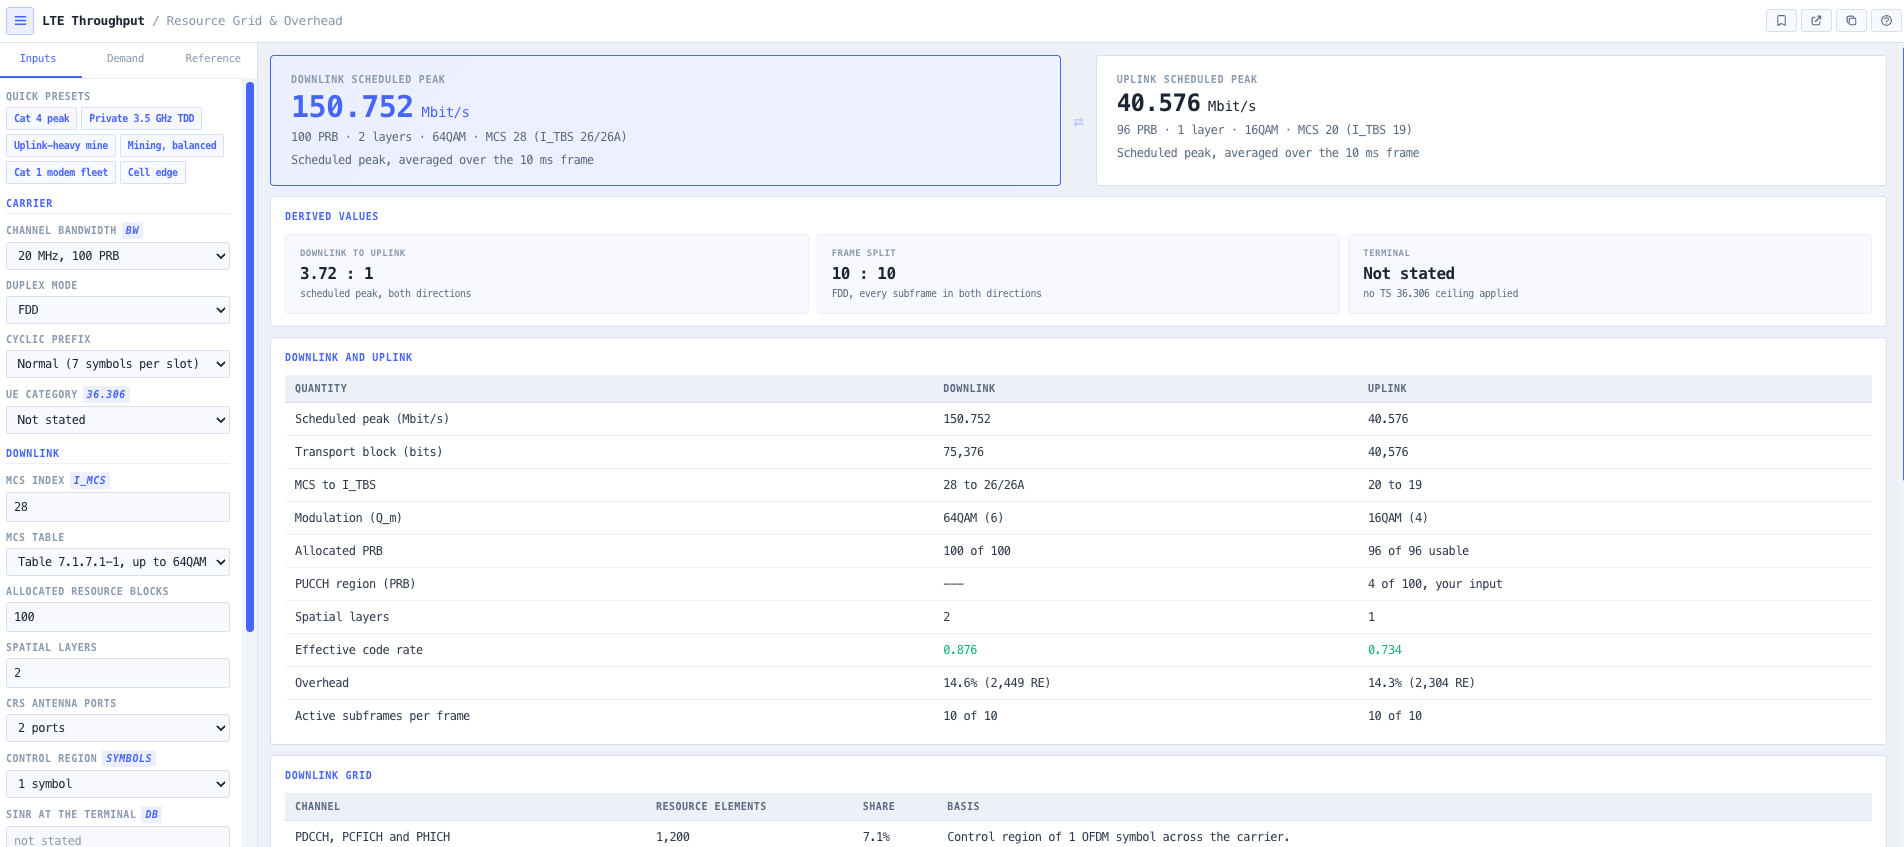
The control region at the band edges is resource blocks taken off the carrier, so the shared uplink channel can be given at most the transmission bandwidth less that region, and the transport block is looked up at what is actually allocated. A tool that reads the block at the full carrier and subtracts the control region afterwards overstates a full-carrier uplink by several per cent. The region is a cell configuration, so it is your input and is printed as such.

Downlink and uplink side by side

Each direction has its own MCS, allocation and layers, and both are on the page at once with the ratio between them and the subframes each one gets. In a TDD design the asymmetry is the decision, and a page that shows one direction at a time hides it.

The terminal is a ceiling, and it is applied

State a UE category and the grid figure is checked against what that category can take per TTI from TS 36.306. A grid that asks more is limited by the device, not the air interface, and the page says so. Categories without 64QAM in the uplink are scheduled at 16QAM for MCS 21 to 28, as TS 36.213 clause 8.6.1 requires, which is how a Cat 4 terminal reaches its 51 Mbit/s uplink peak.

Service demand against the grid

List the services on the site with a terminal count, a rate per terminal in each direction and an activity factor, and read the offered load against the scheduled peak with your own target utilisation applied. No row is seeded with a rate, because what a camera asks for is the site's number rather than LTE's. The share of the grid assumes every terminal at the configured MCS and is labelled as a floor on utilisation, not a prediction of it.

A rate at a stated SINR, from 3GPP's own link model

Type the SINR at the terminal and the page gives the rate from the attenuated Shannon bound of TR 36.942 Annex A.1, the same figure the Private Cellular Network Planner uses, beside the scheduled peak. It does not infer an MCS from the SINR, because 3GPP does not specify that mapping and any table that claimed to would be an invention.

A pinned reference with exact deltas

Pin a configuration, change inputs, and read the exact change in each result beside the list of inputs that moved. Nothing apportions the change between inputs, because the transport block table is not separable that way.

Every figure carries its specification, table and Release

Each value on the page names the document, the table and the Release it came from, so a number can be checked against the source rather than taken on trust.

Standards & methodology

  • 3GPP TS 36.213 V17.7.0 Table 7.1.7.2.1-1, transport block sizes
  • 3GPP TS 36.213 Tables 7.1.7.1-1, 7.1.7.1-1A and 8.6.1-1, MCS tables
  • 3GPP TS 36.211 V17.4.0 Tables 4.2-1, 4.2-2 and 6.2.3-1, frame and grid structure
  • 3GPP TS 36.101 V17.19.0 Table 5.6-1, channel bandwidth to resource blocks
  • 3GPP TS 36.306 V17.11.0 Tables 4.1-1 and 4.1-2, UE category ceilings and uplink 64QAM support
  • 3GPP TS 36.213 clause 8.6.1, uplink modulation order for terminals without 64QAM
  • 3GPP TR 36.942 V17.0.0 Annex A.1 and Table A.2, throughput against SINR
  • Release 17 throughout, with the Release stated on every value

When to use this tool

  • Sizing a private LTE carrier for a mine, port, utility or rail network
  • Checking whether a vendor quoted peak rate is achievable on the configured grid
  • Choosing a TDD uplink downlink configuration for an uplink heavy industrial site
  • Working out cell edge throughput at a realistic resource block allocation
  • Understanding where the overhead actually goes on a 20 MHz carrier
  • Settling an argument about whether a requested rate is schedulable at all

Frequently asked questions

Why look the throughput up instead of calculating it?

Because that is what the base station does. TS 36.213 Table 7.1.7.2.1-1 gives the transport block size in bits for every combination of transport block size index and allocated resource blocks, and the scheduler reads it. The table is not a smooth function of the inputs, so a formula fitted to it is wrong in exactly the places that matter, and a calculator that derives a size from resource elements is answering a different question from the one the network answers.

Is this the throughput I will measure in the field?

No, and the tool says so on its own result. The scheduled peak is what the grid carries if it is scheduled this way. HARQ retransmissions and scheduler behaviour are not modelled. If you state the SINR at the terminal, the page adds the rate from 3GPP TR 36.942 Annex A.1, which is a published link model rather than a measurement, and it is fitted for 1:2 antennas with no spatial multiplexing. Treat both as what the configuration allows, not as a prediction, and never read either as coverage.

Can it tell me what MCS I will get at a given SINR?

No, and it does not pretend to. 3GPP publishes the CQI table and the MCS tables but not the mapping from SINR to either, because that is link level performance and a vendor implementation matter. What 3GPP does publish for exactly this purpose is a throughput against SINR model in TR 36.942, and that is what the page uses. Any table of SINR to MCS would be an invention presented as a standard.

Why does the uplink show 16QAM when I chose MCS 23?

Because you stated a UE category that has no 64QAM in the uplink. TS 36.306 Table 4.1-2 says which categories support it, and of categories 1 to 12 only 5 and 8 do. For the rest, TS 36.213 clause 8.6.1 sets the modulation order to the lower of 4 and the table value, so MCS 21 to 28 go out at 16QAM with the same transport block. The block is the same size on a smaller constellation, so the code rate rises, and that is what a Cat 4 uplink peak actually costs.

Where do the demand figures come from?

From you. No service is seeded with a rate, because how much a camera or a handset asks for in the busy hour is a property of the site and not of LTE. The activity factor is a column of its own for the same reason: a table without one hides a factor of two or three in somebody's head. The share of the grid the demand takes assumes every terminal at the configured MCS, so it is a floor on utilisation rather than a prediction of it. Turning it into a real utilisation needs the SINR distribution over the served area, which is the Network Planner's job.

What is the effective code rate check for?

It catches combinations that cannot be transmitted. The transport block plus its 24 bit CRC has to fit in the data resource elements times the bits per symbol. Above a code rate of one it does not fit and the combination is unschedulable; above about 0.93 it fits but will not decode reliably. A table lookup on its own reports a throughput figure for both cases, which is how impossible configurations end up in design documents.

Why are reference signals counted only outside the control region?

Because the control region already accounts for those symbols in full. Counting the reference signals inside it a second time subtracts the same resource elements twice. The result is a plausible looking number that is simply low, with nothing to indicate the error, which is what makes it worth being explicit about.

Does it handle TDD properly?

Yes. All seven uplink downlink configurations from TS 36.211 Table 4.2-2 are implemented with their actual subframe patterns, along with the special subframe. TDD throughput is dominated by how many subframes carry your direction, and the configurations differ by a factor of three on the uplink, so applying the real pattern rather than a nominal split is the whole point.

Why does MCS 29 report nothing?

Because it carries no transport block size. MCS 29 to 31 signal a retransmission rather than a new transmission, so there is no rate to report. They are shown as reserved. A calculator that interpolates across the table will happily invent a figure for them.

Which Release is this?

Release 17 throughout, and the Release is printed with every value rather than assumed. 3GPP tables change between Releases, so a figure without its edition cannot be checked. Release 17 is the last with substantive LTE change and is what current private LTE equipment ships against.