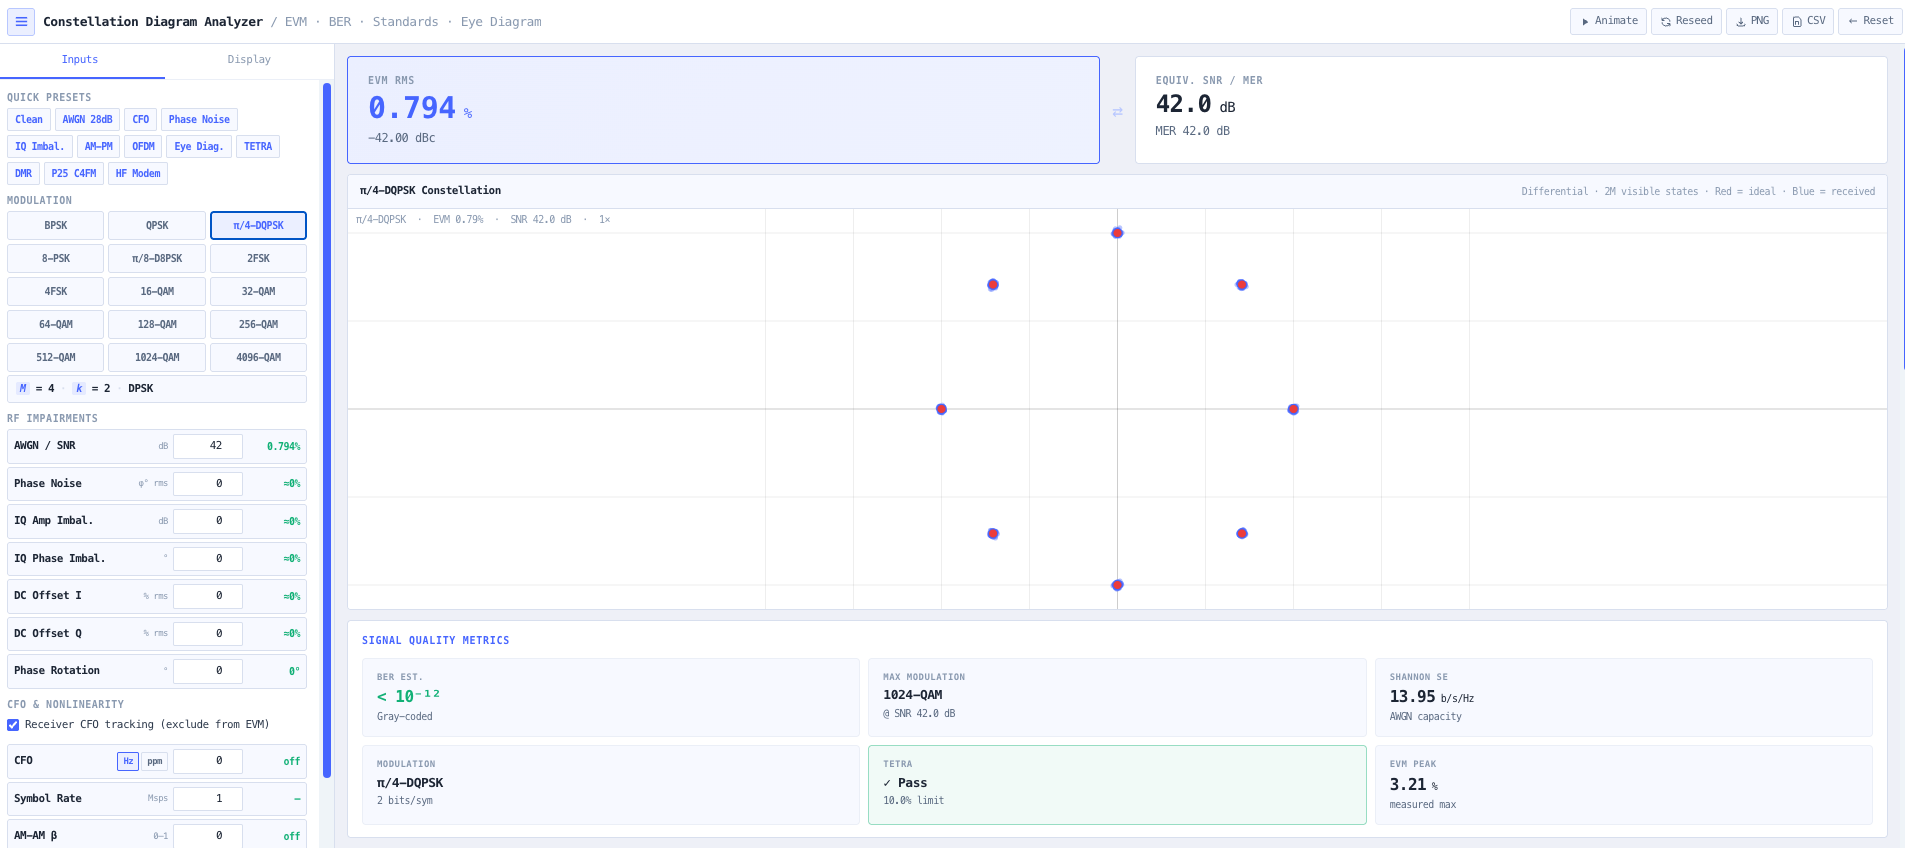
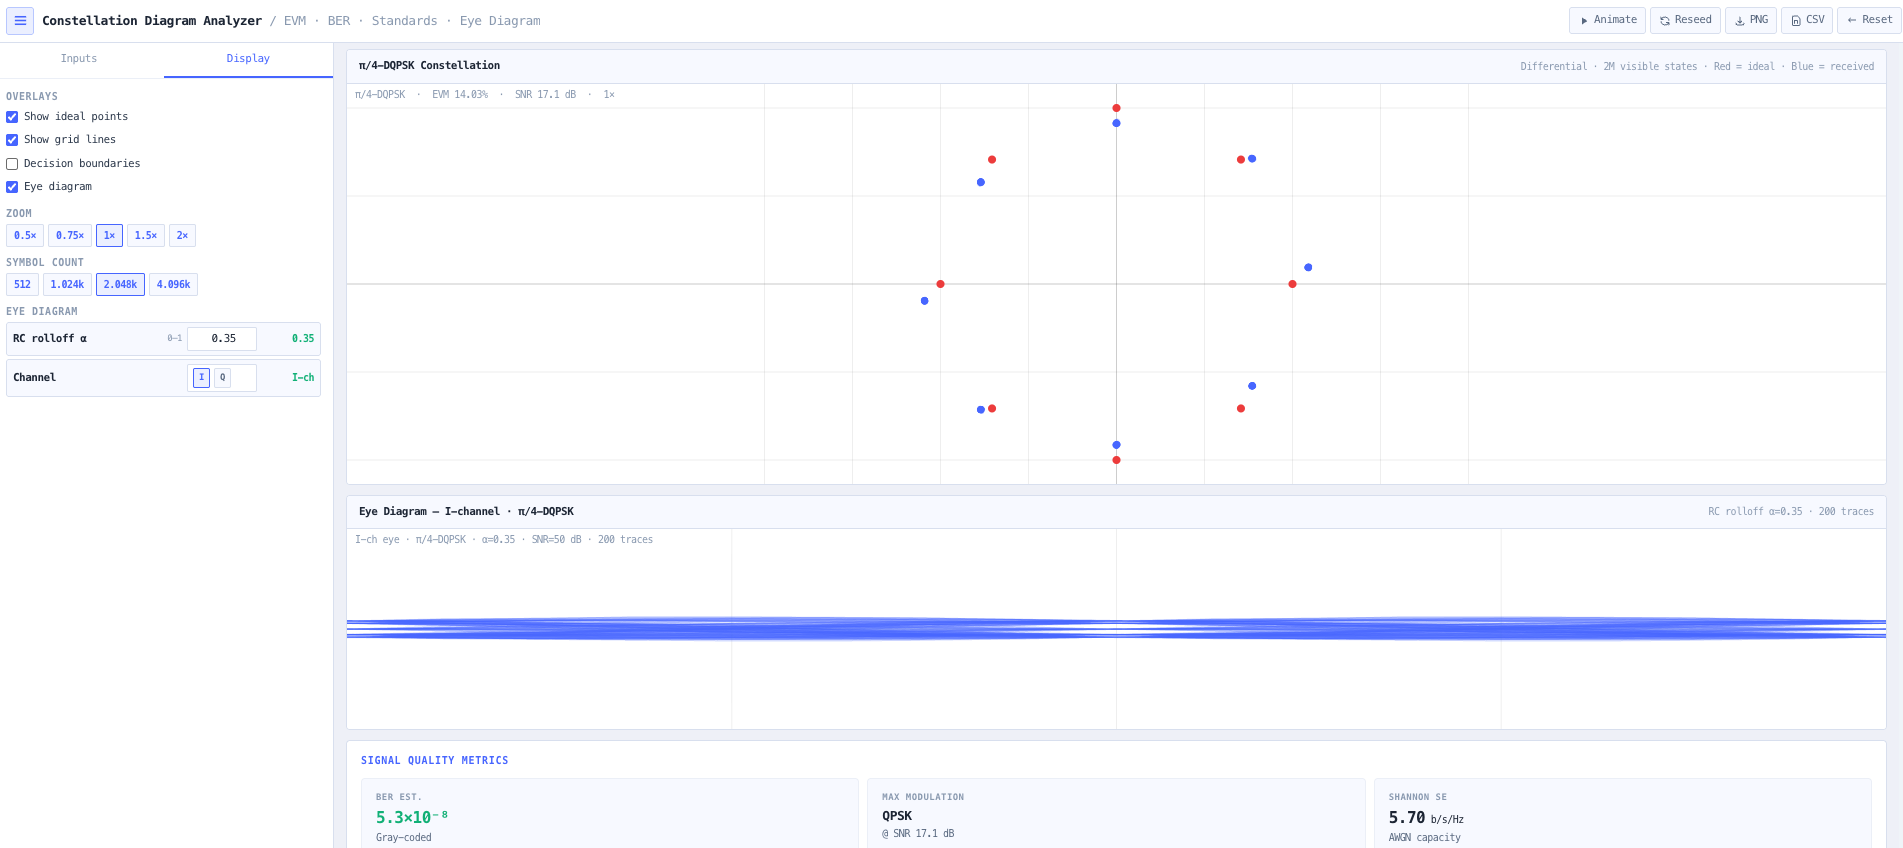
Multi impairment IQ constellation workbench from BPSK to 4096 QAM including the 128 and 512 QAM cross constellations used by microwave backhaul, plus the land mobile radio and narrowband waveforms: pi over 4 DQPSK (TETRA), pi over 8 D8PSK (TETRA TEDS), 4FSK (DMR, P25 C4FM, NXDN), and 2FSK (POCSAG, MPT 1327, RTTY). Apply AWGN, phase noise, IQ imbalance, AM AM and AM PM nonlinearity, carrier frequency offset, OFDM PAPR clipping, and inter carrier interference, with automatic impairment diagnosis and a paired eye diagram view.
Modulation format selector covering BPSK through 4096-QAM plus pi/4-DQPSK, pi/8-D8PSK, 2FSK, and 4FSK, with the ideal point overlay in red.
Overview
What the Constellation Diagram Analyser does
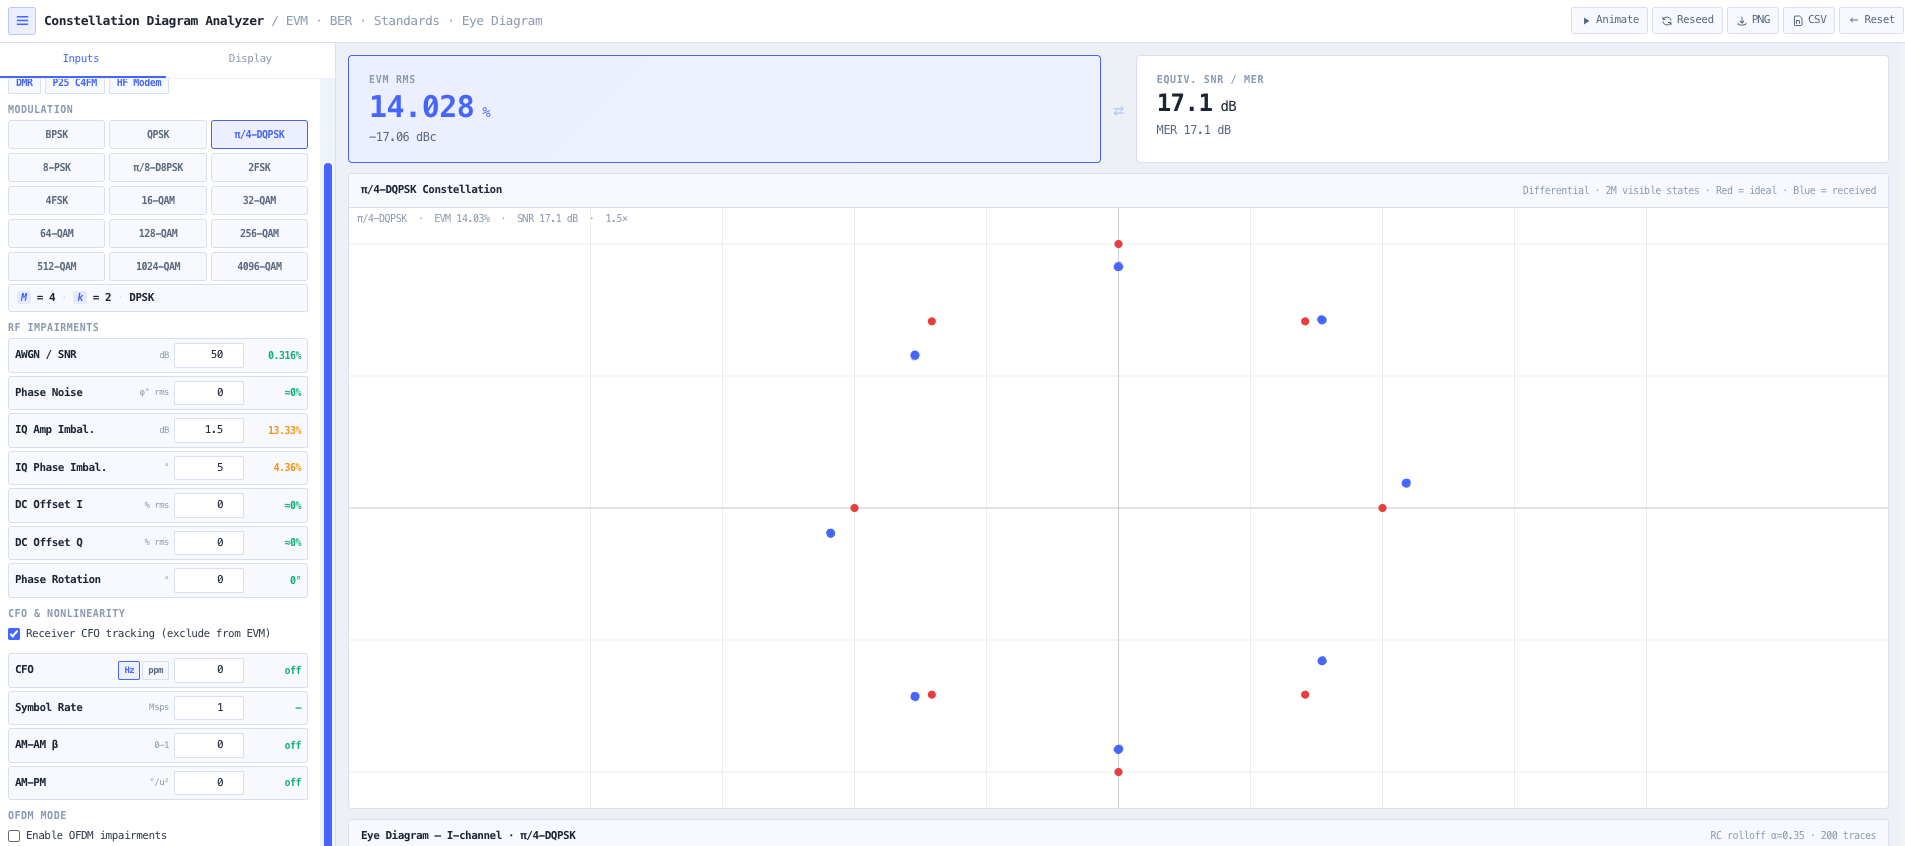
Every RF impairment leaves a fingerprint on the IQ constellation. AWGN noise produces a circular blur around each ideal symbol point. Phase noise smears symbols along arcs centred on the origin. IQ amplitude imbalance compresses one axis. IQ phase imbalance skews the grid. Carrier frequency offset rotates the entire constellation, with the rotation rate proportional to the offset. AM AM nonlinearity compresses outer symbols radially. AM PM rotates outer symbols. DC offset shifts the centre. Each pattern is recognisable to a trained eye, but the recognition takes practice and the design discussion is faster when the tool can name the impairment for you.
Read the full overview
The noIM₃ Constellation Diagram Analyser is a complete IQ signal quality workbench that renders constellations for BPSK, QPSK, 8 PSK, and QAM 16 through QAM 4096, applies nine independent RF impairments in a physically motivated cascade, and automatically diagnoses the dominant degradation mechanism. The impairments map directly to the hardware blocks they originate from. AM AM compression from the power amplifier. AM PM phase shift from the same amplifier nonlinearity. OFDM PAPR clipping from the transmit chain. IQ amplitude and phase imbalance from the modulator. Carrier phase rotation from the synthesiser. Per symbol phase noise from the local oscillator. AWGN from the receive chain. DC offset on each axis.
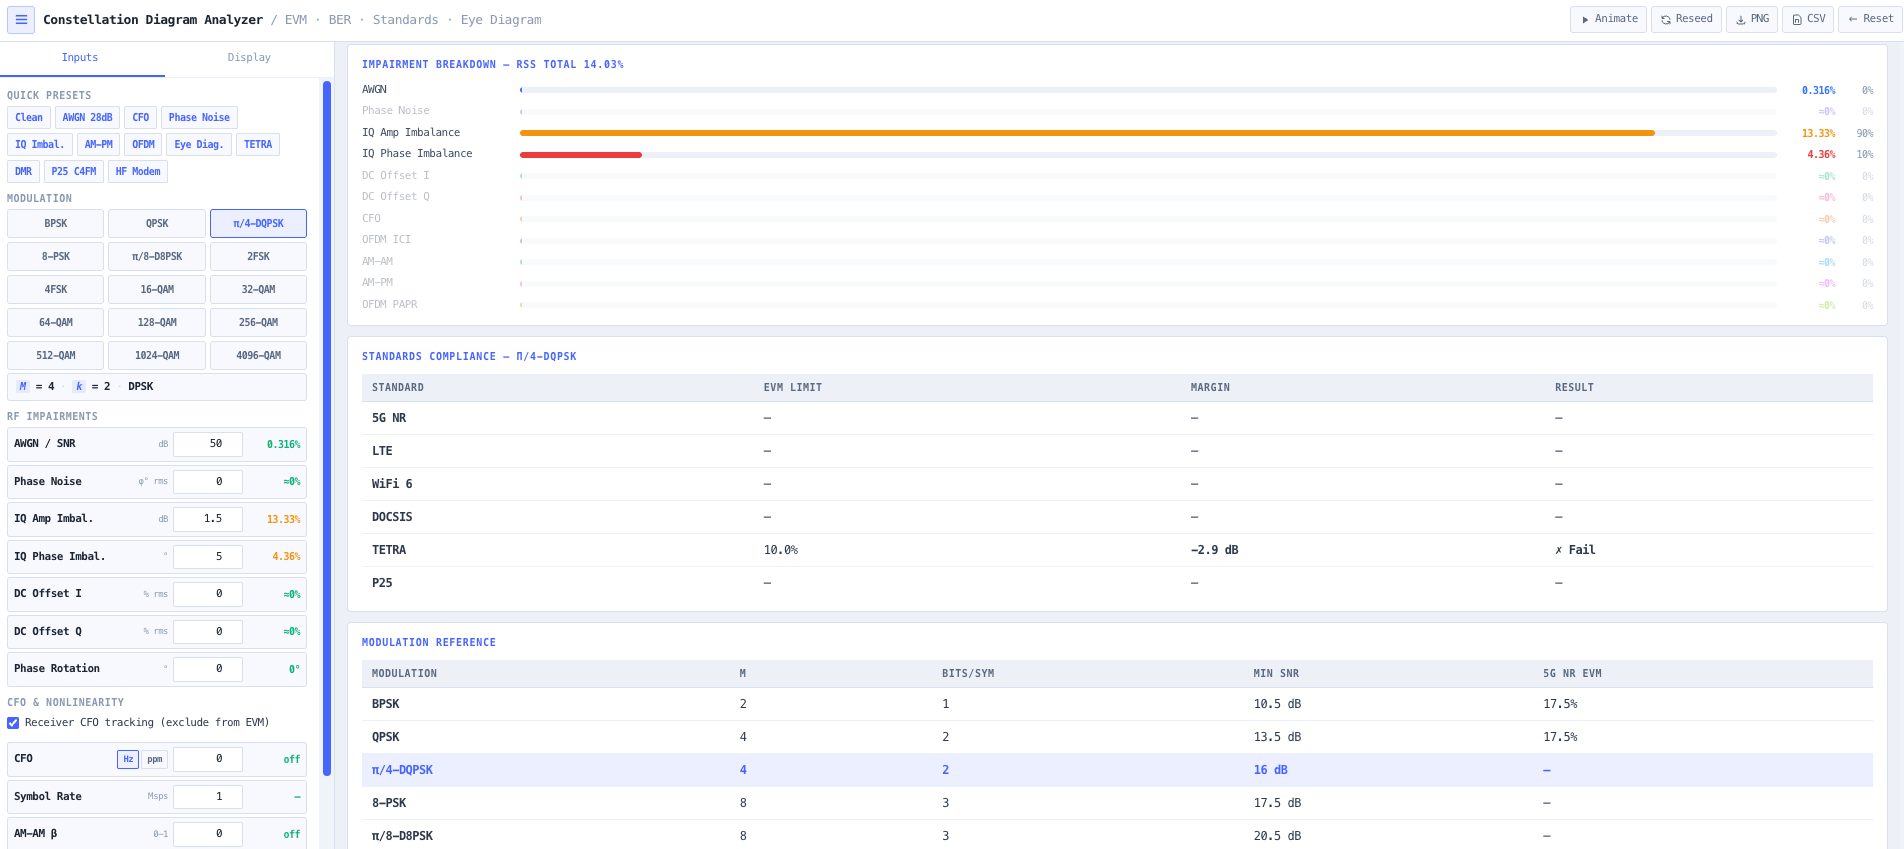
EVM contributions from each source are computed analytically and combined via root sum of squares. AWGN gives EVM equals 100 divided by square root of SNR linear, expressed as percentage. Phase noise gives EVM equals sin of phi rms in radians times 100 per cent. IQ amplitude imbalance gives EVM equals magnitude of (10 to the G over 20 minus 1) divided by square root of 2 times 100 per cent. IQ phase imbalance gives EVM equals magnitude of sin of theta over 2 times 100 per cent. A horizontal bar chart shows each source as a percentage of total EVM power, identifying the dominant impairment. A separate eye diagram panel applies a raised cosine matched filter at configurable rolloff and overlays 200 traces, providing the canonical timing margin and ISI view alongside the constellation.
Capabilities 10
Fifteen modulation formats
BPSK, QPSK, and 8 PSK from the PSK family. Pi over 4 DQPSK (TETRA, P25 CQPSK heritage) and pi over 8 D8PSK (TETRA TEDS) from the differential PSK family, rendered as the full 8 and 16 point visible symbol unions. 2FSK (POCSAG paging, MPT 1327 FFSK control channels, RTTY) and 4FSK (DMR, P25 C4FM, NXDN) rendered in the deviation domain, the convention used by land mobile radio test sets. 16 QAM, 64 QAM, 256 QAM, 1024 QAM, and 4096 QAM from the rectangular QAM family plus the 32, 128, and 512 QAM cross constellations (square grids with corner blocks removed) used by point to point microwave backhaul radios. Ideal points rendered in red and received impaired symbols in blue.
Nine impairment chain
AM AM radial compression r prime equals r over square root of (1 plus beta r squared). AM PM phase rotation delta phi equals alpha r squared. OFDM PAPR hard clip at configurable dB above RMS. IQ amplitude imbalance with I and Q arms scaled inversely. IQ phase imbalance with the Q axis rotated from 90 degrees. Carrier phase rotation. DC offset on I and Q independently. Per symbol phase noise as Gaussian phase rotation. AWGN. Applied in a physically motivated cascade matching the hardware order.
Carrier frequency offset (CFO)
CFO specified in Hz or ppm and converted to a phase increment per symbol. Each rendered symbol accumulates the phase, producing the characteristic arc or ring pattern of uncompensated frequency offset. In animated mode the symbols stream in with cumulative phase, showing the rotation rate visually. Normalised CFO epsilon equals f CFO divided by f sym is displayed for AFC loop budget assessment.
OFDM mode and inter carrier interference
Enabling OFDM mode activates PAPR hard clipping at a configurable level (compresses outer QAM symbols and generates out of band splatter) and inter carrier interference from CFO. ICI EVM is modelled as pi times magnitude of epsilon divided by square root of 3 times 100 per cent (flat spectrum approximation), where epsilon equals f CFO divided by subcarrier spacing. Combined with all other impairments via RSS for total EVM.
Automatic impairment diagnosis
The diagnosis engine identifies the dominant impairment from the EVM breakdown and maps it to a recognisable visual pattern (arc shaped elongation for phase noise, skewed grid for IQ phase imbalance, compressed corners for AM AM, rotated outer symbols for AM PM, shifted centre for DC offset). A recommended corrective action is surfaced alongside the diagnosis so the design discussion moves quickly from observation to fix.
EVM breakdown and metrics
Per source EVM contributions surfaced in a horizontal bar chart showing the share of total EVM power. Total EVM displayed in per cent and dBc, with equivalent SNR and MER. BER estimated using Gray coded Q function (PSK and QAM forms). Shannon spectral efficiency and the maximum achievable modulation order at the current EVM are also reported.
Eye diagram with raised cosine matched filter
Generates 600 random symbols, upsamples at 8 times the symbol rate, applies a raised cosine filter with configurable rolloff alpha (0.01 to 0.99), and adds AWGN. The filtered waveform is chopped into 2 symbol period windows and 200 traces are overlaid. The canonical eye diagram for assessing timing margin, noise margin, and inter symbol interference. I or Q channel selectable.
Live animation and presets
Live streaming animation with age bucket alpha fading at 80 symbols per frame. Preset scenes for clean signal, AWGN, CFO, phase noise, IQ imbalance, AM PM, OFDM, eye diagram, TETRA (pi over 4 DQPSK at 18 ksym per second, rolloff 0.35), DMR, P25 C4FM (4FSK at 4.8 ksym per second, rolloff 0.2), and HF Modem (serial tone 8 PSK at 2.4 ksym per second with HF representative noise and phase jitter) accelerate teaching and design exploration. Symbol count selectable from 512 to 4096 for trade off between detail and rendering speed.
Standards compliance
EVM checked in real time against 5G NR (3GPP TS 38.101 to 1), LTE (3GPP TS 36.101), WiFi 6 (IEEE 802.11ax), DOCSIS 3.1, TETRA (ETSI EN 300 392-2, 10 per cent RMS vector error for pi over 4 DQPSK), and P25 (TIA 102.CAAB, 5 per cent Class A modulation fidelity for C4FM). Pass or fail and margin in dB reported per modulation order. ETSI publishes deviation tolerances rather than an EVM style limit for DMR, so 4FSK is benchmarked against the P25 figure. Useful for pre compliance checks during transmitter design and for educational demonstrations of how each standard sets its EVM bar.
Browser only computation
Runs entirely in your browser. No constellation data, impairment configurations, or design parameters are submitted to a server. Useful for commercially confidential transmitter and receiver design work, defence and intelligence radio development, and environments where information security policy prohibits sending engineering data to third party services.
Inputs and outputs
What goes in, what comes out
Inputs 15
Modulation format (BPSK, QPSK, pi over 4 DQPSK, 8 PSK, pi over 8 D8PSK, 2FSK, 4FSK, 16 QAM, 32 QAM, 64 QAM, 128 QAM, 256 QAM, 512 QAM, 1024 QAM, 4096 QAM)
AWGN SNR in dB
Integrated phase noise phi rms in degrees
IQ amplitude imbalance G in dB
IQ phase imbalance theta in degrees
DC offset I and Q as a percentage of RMS
Carrier phase rotation in degrees
AM AM compression coefficient beta
AM PM distortion coefficient alpha in degrees per unit squared
Carrier frequency offset in Hz or ppm with symbol rate
OFDM PAPR clip level in dB above RMS
OFDM subcarrier spacing for ICI calculation
Symbol count (512, 1024, 2048, 4096)
Raised cosine rolloff alpha for eye diagram
Optional preset scene (clean, AWGN, CFO, phase noise, IQ imbalance, AM PM, OFDM, eye diagram)
Outputs 13
Rendered constellation with ideal and received symbol points
Live animation with age bucket fading
Eye diagram with raised cosine filtered traces
Total EVM in per cent, dBc, equivalent SNR, and MER
Per source EVM breakdown bar chart
Automatic impairment diagnosis with recommended fix
BER estimate from Gray coded Q function
Shannon spectral efficiency at the operating EVM
Maximum achievable modulation order at the current EVM
Standards compliance verdict (5G NR, LTE, WiFi 6, DOCSIS 3.1, TETRA, P25) with margin in dB
Decision boundary and grid overlay (toggleable)
Normalised CFO epsilon for AFC loop budget
PNG export of the constellation
Standards & methodology
3GPP TS 38.101 to 1. 5G NR User Equipment radio transmission and reception
3GPP TS 36.101. LTE User Equipment radio transmission and reception
IEEE 802.11ax to 2021. WiFi 6 PHY specification
CableLabs DOCSIS 3.1 PHY specification
ETSI EN 300 392-2. TETRA air interface, pi over 4 DQPSK vector error limits (RMS 0.1, peak 0.3)
TIA 102.CAAB. Project 25 C4FM and CQPSK transceiver performance, modulation fidelity limits
ETSI TS 102 361-1. DMR air interface, 4FSK modulation and deviation tolerances
Saleh model for AM AM and AM PM nonlinearity
Raised cosine matched filter convention for eye diagram
Use cases
When to use this tool
01Transmitter IQ impairment characterisation including AM AM, phase noise, and IQ imbalance identification
02Receiver sensitivity verification with SNR margin against modulation minimum for BER less than or equal to 10 to the minus 3
03Carrier frequency offset tolerance budget analysis
04OFDM system design assessment of combined PAPR clipping and ICI effects
05IQ calibration validation that calibration corrects skew and scale before over the air test
06Training aid for new RF and digital engineers learning impairment patterns visually
07Standards pre compliance check against 5G NR, LTE, WiFi 6, DOCSIS 3.1, TETRA, and P25 EVM limits
08Land mobile radio waveform familiarisation for TETRA pi over 4 DQPSK and DMR or P25 4FSK eye diagrams ahead of test set work
09Eye diagram analysis for timing margin and matched filter performance with different rolloff values
10Phase noise budget allocation across local oscillator and synthesiser blocks
11Power amplifier nonlinearity impact assessment on outer constellation symbols
12Digital pre distortion algorithm validation against measured AM AM and AM PM curves
13Producing teaching materials and reference visualisations for RF and DSP courses
Fifteen modulation formats. BPSK, QPSK, and 8 PSK from the PSK family. Pi over 4 DQPSK and pi over 8 D8PSK from the differential PSK family, rendered as the 8 and 16 point visible symbol unions. 2FSK and 4FSK rendered in the deviation domain. 16 QAM, 64 QAM, 256 QAM, 1024 QAM, and 4096 QAM from the rectangular QAM family, plus the 32, 128, and 512 QAM cross constellations rendered correctly as square grids with the corner blocks removed (6 by 6 minus 1 by 1 corners, 12 by 12 minus 2 by 2, 24 by 24 minus 4 by 4) — the formats point to point microwave backhaul radios actually run. Ideal points are rendered in red and received impaired symbols in blue throughout.
Are TETRA, DMR, and P25 waveforms supported?
Yes. Pi over 4 DQPSK is the TETRA voice plus data waveform (ETSI EN 300 392-2, 18 ksym per second, root raised cosine rolloff 0.35), pi over 8 D8PSK is the TETRA TEDS phase modulation, and 4FSK covers DMR (ETSI TS 102 361-1), P25 Phase 1 C4FM (TIA 102), and NXDN, all at 4.8 ksym per second. 2FSK covers POCSAG paging, MPT 1327 FFSK control channels, and RTTY. FSK formats are rendered in the deviation domain (deviation levels at plus or minus one third and plus or minus full deviation for 4FSK) as land mobile radio test sets display them, and their EVM corresponds to the FSK error or modulation fidelity figure those test sets report. Because an FM transmitter has no IQ modulator, the linear modulator impairments (IQ imbalance, DC offset, carrier phase, AM AM and AM PM, CFO rotation) are disabled for FSK formats — AWGN and phase noise act on the deviation trajectory. Compliance rows cover the TETRA 10 per cent RMS vector error limit and the P25 Class A 5 per cent modulation fidelity limit. ETSI publishes deviation tolerances rather than an EVM style limit for DMR, so no invented DMR limit is shown. Dedicated TETRA, DMR, and P25 C4FM presets load the correct symbol rate, rolloff, and band.
What about HF modem waveforms?
HF serial tone modems (MIL-STD-188-110, STANAG 4285, STANAG 4539) transmit PSK and QAM constellations that are already covered: 8 PSK for the classic 2400 symbol per second serial tone waveforms and 16 QAM through 256 QAM for the wideband appendices. The HF Modem preset loads serial tone 8 PSK at 2.4 ksym per second with HF representative noise and phase jitter. RTTY and SITOR are 2FSK, also covered. ALE (MIL-STD-188-141 8 tone FSK) and FT8 style waveforms are orthogonal multi tone signalling with no IQ symbol constellation to display — they are measured on a spectrum view, so they belong in the FFT Spectrum Analyser rather than a constellation tool, and no invented constellation rendering is offered for them.
How does the impairment chain work?
Nine impairments are applied in a physically motivated cascade matching the hardware signal flow. AM AM radial compression first (from the power amplifier). Then AM PM phase rotation. OFDM PAPR clipping in OFDM mode. IQ amplitude imbalance from the modulator. IQ phase imbalance. Carrier phase rotation. DC offset on each axis. Per symbol phase noise from the local oscillator. AWGN from the receive chain. Each impairment can be enabled or disabled independently so the visual signature of each one can be studied in isolation.
How does automatic diagnosis work?
Per source EVM contributions are computed and surfaced as a percentage of total EVM power. The diagnosis engine identifies the dominant contributor and maps it to the recognisable visual pattern. Phase noise produces arc shaped elongation. IQ phase imbalance produces a skewed grid. AM AM produces compressed outer corners. AM PM produces rotated outer symbols. DC offset produces a shifted centre. The matched pattern and a recommended corrective action are surfaced together.
How is CFO modelled?
Carrier frequency offset is specified in Hz or ppm and converted to a phase increment per symbol delta phi equals 2 pi times f CFO divided by f sym. Each rendered symbol accumulates the phase increment, producing the characteristic arc or ring pattern of uncompensated frequency offset. In OFDM mode, ICI EVM is modelled as pi times magnitude of epsilon divided by square root of 3 times 100 per cent, where epsilon equals f CFO divided by subcarrier spacing.
How does the eye diagram view work?
A separate eye diagram panel generates 600 random symbols at the selected modulation order, upsamples at 8 times the symbol rate, applies a raised cosine matched filter with configurable rolloff alpha (0.01 to 0.99), and adds AWGN at sigma equal to EVM divided by 100. The filtered waveform is chopped into 2 symbol period windows and 200 traces are overlaid to produce the canonical eye diagram. I or Q channel selectable. Useful for assessing timing margin, noise margin, and inter symbol interference alongside the constellation view.
How is BER estimated?
BER is estimated using the Gray coded Q function for PSK and QAM. PSK BER is approximately 2 over k times Q of (square root of 2 Es over N0) times sin of (pi over M). QAM BER is approximately 4 over k times (1 minus 1 over square root of M) times Q of (square root of 3 Es over N0 over (M minus 1)). These are the standard approximations used across the industry for AWGN performance estimation.
How does this relate to the EVM Calculator and FFT Spectrum Analyser?
The EVM Calculator focuses on quantitative EVM with budget allocation and standards compliance. The Constellation Diagram Analyser provides the visual view that shows what each impairment looks like and automatically diagnoses the dominant one. The FFT Spectrum Analyser shows the frequency domain signature alongside. Use the EVM Calculator for budget allocation. Use the Constellation Diagram Analyser to visualise and diagnose impairments. Use the FFT Spectrum Analyser to confirm spectral signature.
Does any data leave my browser?
No. The analyser runs entirely in your browser. No constellation data, impairment configurations, or design parameters are submitted to a server. Useful for commercially confidential transmitter and receiver design work, defence and intelligence radio development, and environments where information security policy prohibits sending engineering data to third party services.