System Capacity Design

Composite RF Power Loading Calculator

Average and peak RF power through a shared passive device for a mixed fleet of transmitters. Separate incoherent power-sum and coherent envelope (PEP) peaks, deterministic and statistical occupancy peak models, thermal dissipation, and pass or fail against the device average and peak ratings.

Free forever on a Standard account. No credit card.

Overview

When a large radio or microwave system funnels many transmitters through one shared passive device — a switch matrix, a combiner, a multiplexer, a circulator — the question that actually sizes that hardware is not how many transmitters there are, but how much power passes through it. Average power sets the thermal load and the device continuous rating. Peak power sets the device peak rating. Get either wrong and the shared device runs hot, derates, or fails in service. A spreadsheet that simply multiplies power by the number of radios overstates the average badly and says nothing useful about the peak.

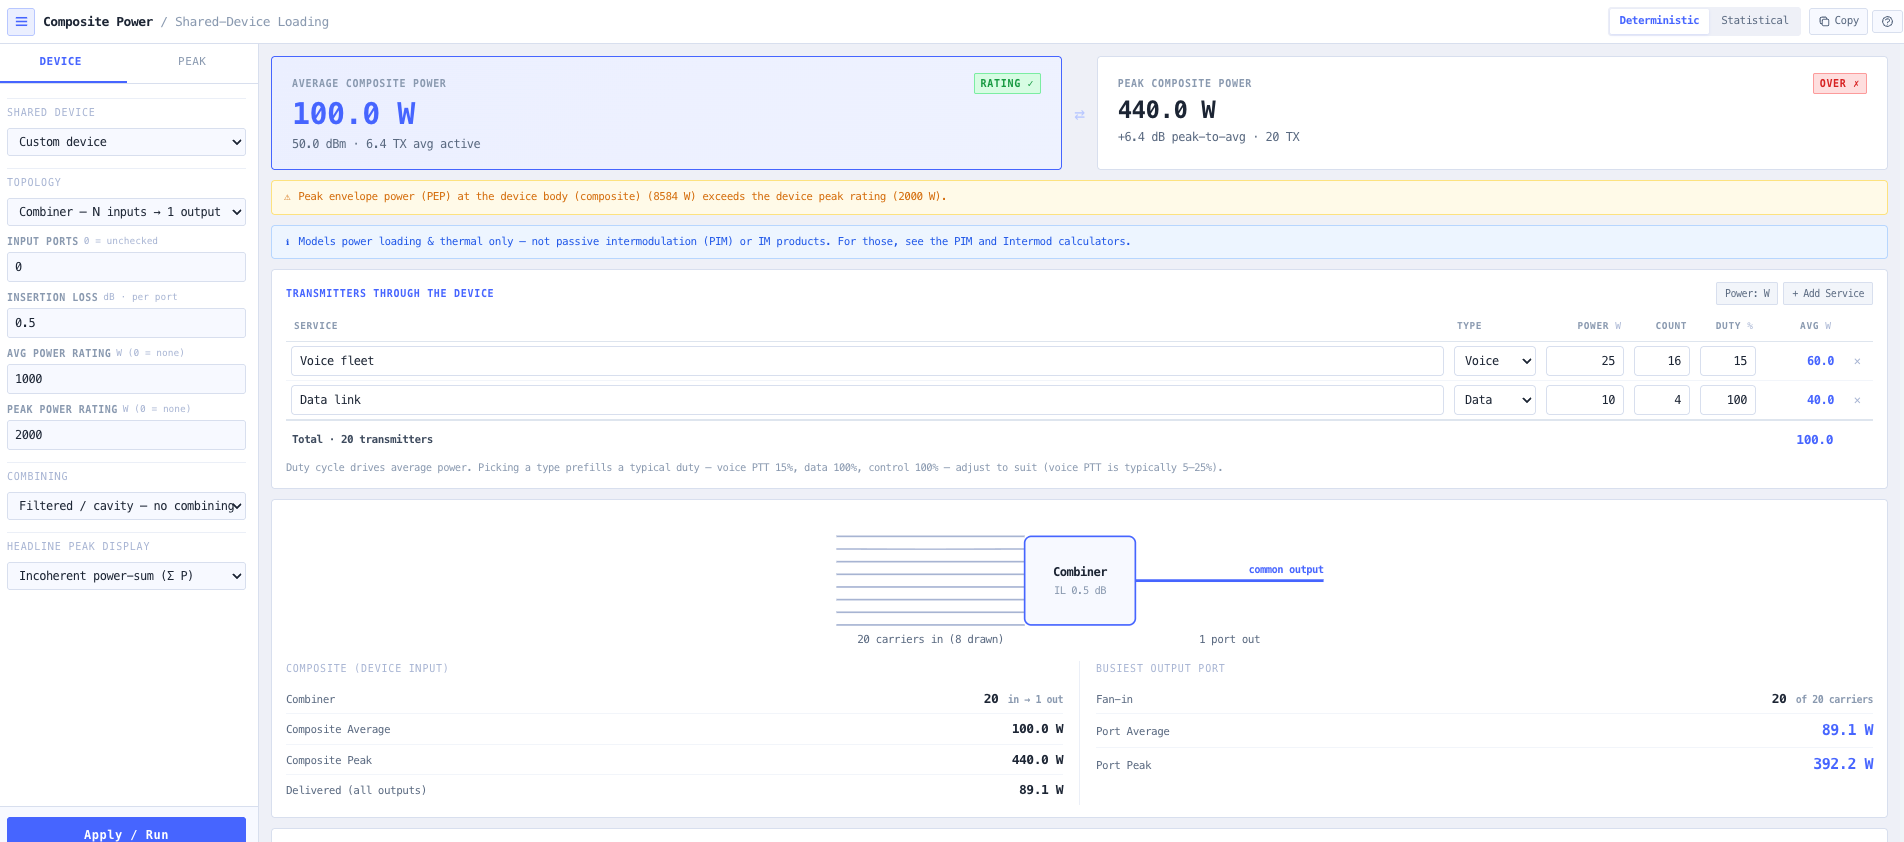
The noIM₃ Composite RF Power Loading Calculator answers the question from a systems-integrator point of view. You describe the shared device and build a per-service table of transmitter power, count, and duty cycle, and the tool returns the duty-weighted average composite power, the two physically distinct peak powers, the thermal dissipation, and a pass or fail against the device ratings. It is built for the engineer specifying the distribution hardware, not for circuit-level design.

The two peaks matter because passive-device datasheets rate them separately. The incoherent power-sum adds the time-averaged powers of the carriers that are keyed at once and is the figure for the average power rating. The coherent peak envelope power is the worst case when the carrier voltages align in phase and reaches the square of the sum of the square roots of the carrier powers, which for N equal carriers is N times the incoherent figure and is the figure for the peak rating. The peak can be driven as a deterministic worst case or as a statistical occupancy peak at a chosen confidence, using the same offered-load definition as the Erlang B and C calculators so a traffic-sized fleet flows straight into the power budget.

Capabilities

Duty-weighted average composite power

The average composite power is the sum over every service of count times duty cycle times per-transmitter power. Because it is duty-weighted it captures the real difference between a low-duty voice fleet and a continuous data link of the same power, and it is the figure that drives both the device average power rating and the heat dissipated in the rack.

Incoherent and coherent peaks side by side

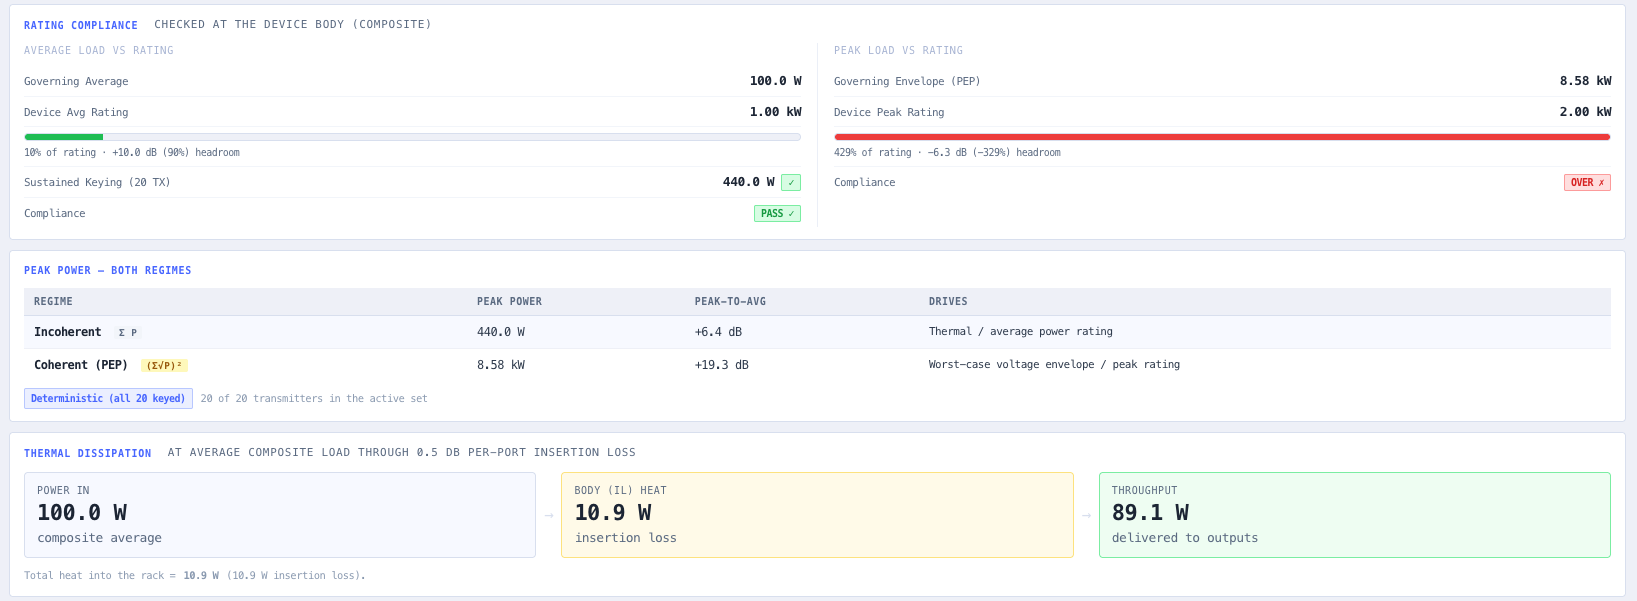
The incoherent power-sum adds the powers of the simultaneously keyed carriers and is the figure for the average power rating. The coherent peak envelope power is the worst case when carrier voltages align in phase, N times higher for N equal carriers, and is the figure for the peak power rating. Both are shown together with their peak-to-average ratios so you size against the right one.

Deterministic and statistical peak models

Deterministic mode keys a fixed maximum number of the highest-power transmitters at once for a conservative worst case. Statistical mode treats each transmitter as an independent on/off source and reports the peak at a P90, P95, or P99 confidence from the occupancy distribution, the realistic peak for a large fleet where not every radio keys at the same instant.

Erlang-consistent offered load

The statistical model uses the offered load equal to the sum of count times duty as the expected number of transmitters simultaneously keyed, the same definition the Erlang B and C calculators use. A fleet sized for traffic in those tools can be carried straight into this power budget without redefining the activity assumptions.

Topology-aware port routing

A combiner funnels every carrier onto one output, so that port carries the full composite. A switch matrix distributes the carriers across many outputs, so the worst-case stress is only the busiest output’s fan-in, not the total — the calculator assumes the worst-case grouping at the busiest output and checks the rating there, and a live schematic draws the carriers, the device, and the highlighted busiest port. A multiplexer is treated as a frequency-selective common port. Filtered and resistive combining are modelled separately, with the resistive case dumping ten times log ten of the carrier count in dB into the isolation loads.

Thermal dissipation for the rack budget

The average composite power is split through the device insertion loss into the heat dissipated inside the device and the power delivered past it. The dissipated figure is the watts of heat the shared device adds to the rack, ready to feed into a communications-rack heat-load schedule.

Device rating compliance with headroom

The average load is checked against the device average power rating and the peak load against the device peak power rating. Each reports the headroom in dB and as a percentage of the rating with a clear pass or over indication, and a warning is raised when either rating is exceeded. A third check covers incident traffic: the sustained simultaneous-keying load is also checked against the average rating, catching the fleet whose duty-weighted average passes but whose sustained all-keyed load would not.

Honest, bounded scope

The tool models power loading and thermal dissipation only. It does not model passive intermodulation, intermodulation products, frequency-dependent loss, route differences through a switch matrix, or per-carrier modulation PAPR — the coherent envelope assumes constant-envelope carriers, so enter per-carrier PEP for digital modulations. The boundary is stated in the tool rather than implied, with a pointer to the PIM and Intermod calculators for those questions.

Standards & methodology

  • Incoherent power summation for uncorrelated carriers (time-averaged power)
  • Coherent peak envelope power (PEP) for in-phase multi-carrier voltage addition
  • Independent on/off occupancy model for statistical peak estimation
  • Insertion-loss thermal dissipation for passive devices

When to use this tool

  • Sizing a switch matrix or combiner for a fleet of mixed voice and data transmitters
  • Checking composite average power against a passive device average power rating
  • Checking the coherent peak envelope power against a device peak power rating
  • Estimating the heat a shared RF device adds to a communications rack
  • Comparing the realistic statistical peak against the deterministic worst case for a large fleet
  • Converting an Erlang-sized radio fleet into a power budget for the shared distribution hardware
  • Documenting an equipment selection decision for a multi-carrier combiner or multiplexer
  • Sanity-checking a vendor multi-carrier power rating against the actual carrier mix

Is this the right tool for you?

Reach for the Composite RF Power Loading Calculator in any of the following situations.

  • You are running twenty mixed voice and data transmitters through one switch matrix and need to know the average and peak power the matrix must handle.
  • You are choosing a multi-carrier combiner and need to check both the average (CW) and peak power against the datasheet ratings rather than guessing.
  • You are preparing a communications-rack heat-load schedule and need the watts of heat the shared RF device dissipates at the real duty-weighted average load.
  • You have already sized a radio fleet with the Erlang B or C calculator and want to carry that same offered-load assumption into the power budget for the distribution hardware.
  • You need to decide whether the conservative deterministic worst case or the realistic statistical peak is the right number for a large fleet where not every radio keys at once.
  • You are documenting an equipment selection decision and need a clear pass or fail against the device average and peak ratings with the headroom stated in dB.

Frequently asked questions

Why are there two different peak power figures?

Passive-device datasheets rate average and peak power separately. The incoherent power-sum adds the time-averaged powers of the carriers and is the figure for the average (CW) rating. The coherent peak envelope power is the worst case when the carrier voltages align in phase and reaches the square of the sum of the square roots of the powers, N times higher for N equal carriers, and is the figure for the peak rating. The tool shows both so you can size against the correct one.

Should I use the deterministic or the statistical peak?

Use the deterministic peak for a conservative worst case, where a fixed maximum number of transmitters key at once. Use the statistical peak for a large fleet where not every transmitter keys at the same instant; it treats each transmitter as an independent on/off source and reports the peak at a confidence level (P90, P95, P99) from the occupancy distribution. For a small number of high-consequence carriers the deterministic worst case is usually the safer choice.

How does the duty cycle affect the result?

Duty cycle is the fraction of time a transmitter is keyed. The average composite power is duty-weighted, so a voice fleet at fifteen per cent duty contributes far less to the average and to the heat load than a continuous data link of the same power. The peak power, by contrast, depends on how many transmitters are keyed at once rather than on the long-run duty cycle.

Does this calculator model passive intermodulation?

No. It models power loading and thermal dissipation only. It does not model passive intermodulation (PIM), intermodulation products, frequency-dependent loss, differences between the routes through a switch matrix, or per-carrier modulation PAPR (enter per-carrier PEP for digital modulations). For intermodulation questions use the PIM and Intermod calculators; the boundary is stated explicitly in the tool.

Is this tool for circuit design?

No. It is built for the systems integrator specifying the shared distribution hardware — the switch matrix, combiner, multiplexer, or circulator — not for PCB or component-level design. The inputs and outputs are framed around device ratings, thermal load, and equipment selection.