Three calculation modes
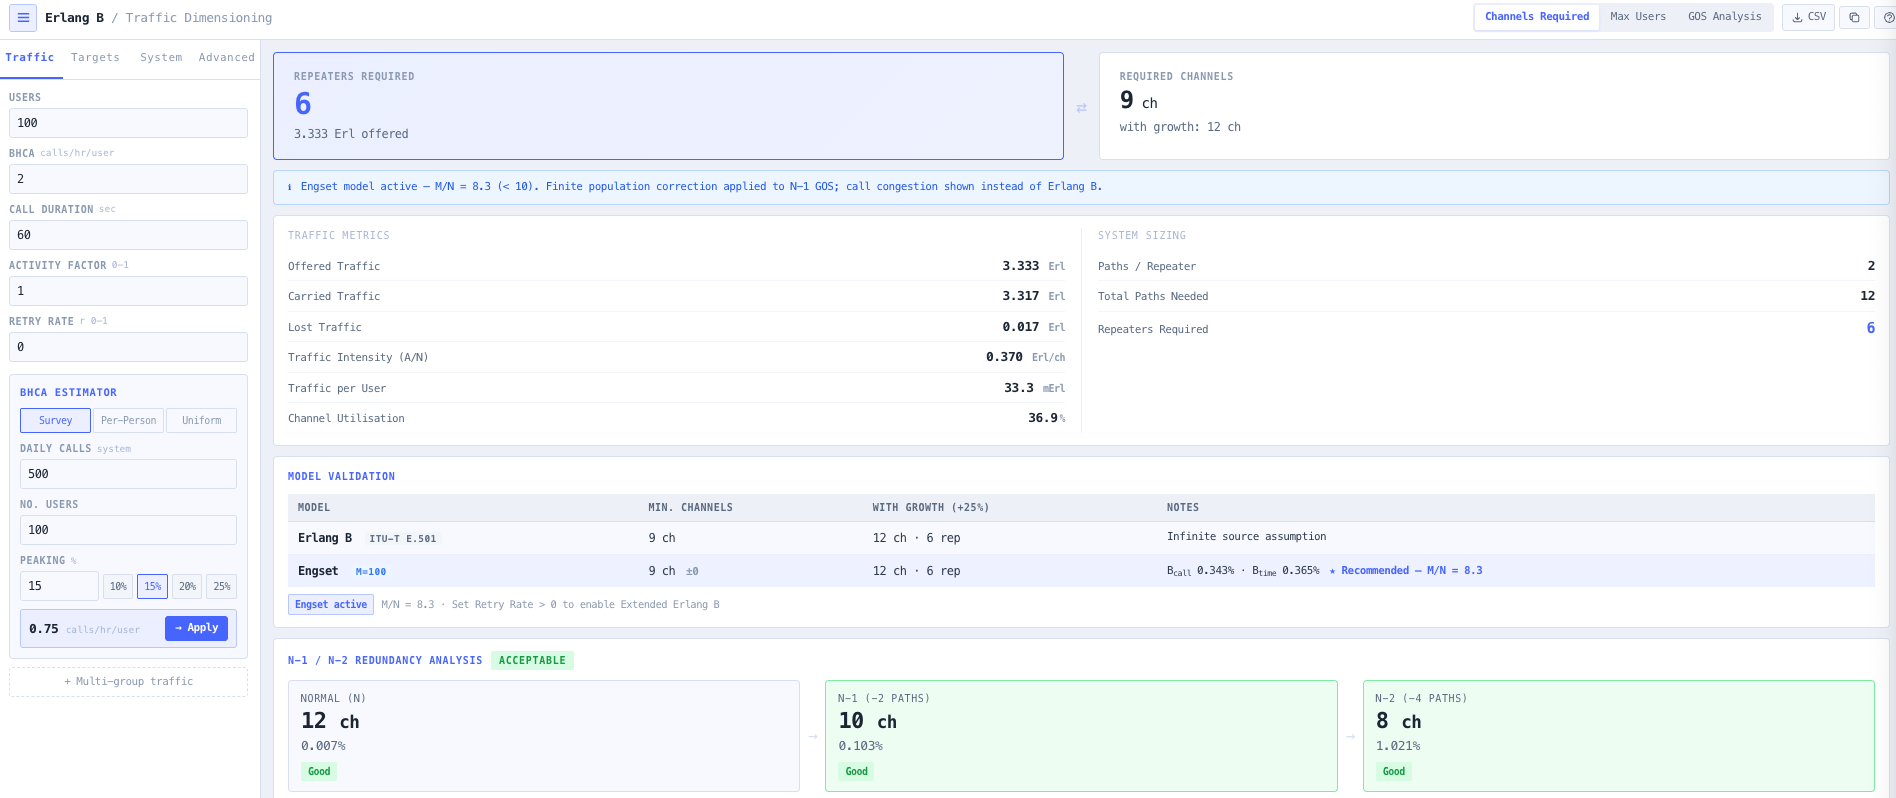
Channels Required, Max Users, and GOS Analysis. The first finds the minimum channel count to meet a grade of service target. The second finds the largest fleet a fixed channel plan can support. The third evaluates blocking probability for a given channel count and offered traffic. All three drive the same downstream outputs, so switching modes is non destructive.
Multi model validation
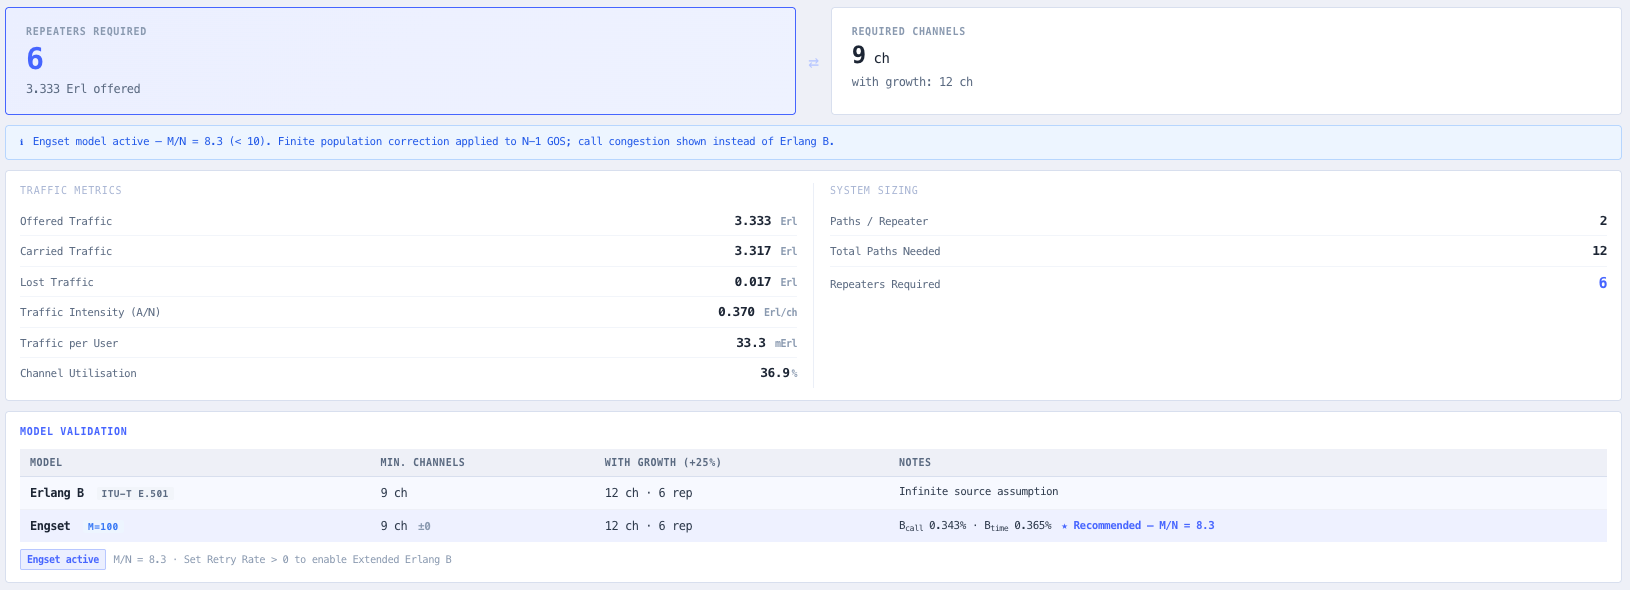
Every result is automatically cross checked against Erlang B, Engset, and Extended Erlang B. Engset activates a recommendation when the user to channel ratio falls below ten and Erlang B starts to materially understate required channels. Extended Erlang B iterates the effective offered traffic upwards to account for retry behaviour with a configurable retry fraction. The model comparison panel shows all three side by side so engineers can document the rationale for the model chosen.
BHCA estimator and multi group aggregation
Traffic can be entered directly or derived using the built in busy hour call attempts (BHCA) estimator, which supports three survey methods. System level daily call counts with busy hour peaking. Per person calls per shift. Uniform distribution across shift hours. For heterogeneous fleets, the multi group aggregator accepts separate user populations with individual BHCA, average hold time, and activity factor inputs and computes aggregate offered traffic automatically.
N minus 1 redundancy analysis
The N minus 1 panel models the impact of losing one repeater from the designed pool, recalculating blocking probability and flagging whether the degraded system remains within an acceptable grade of service. Essential for critical infrastructure, public safety, and any network where a single repeater outage cannot be allowed to take the service down.
Sensitivity sweep
A sensitivity table sweeps offered traffic across a configurable range, showing required channels, repeaters, and blocking at each load point. Lets planners identify the tipping points where adding one more user or one more channel changes the system materially, and validates the design margin against expected growth.
Busy hour scenario comparison
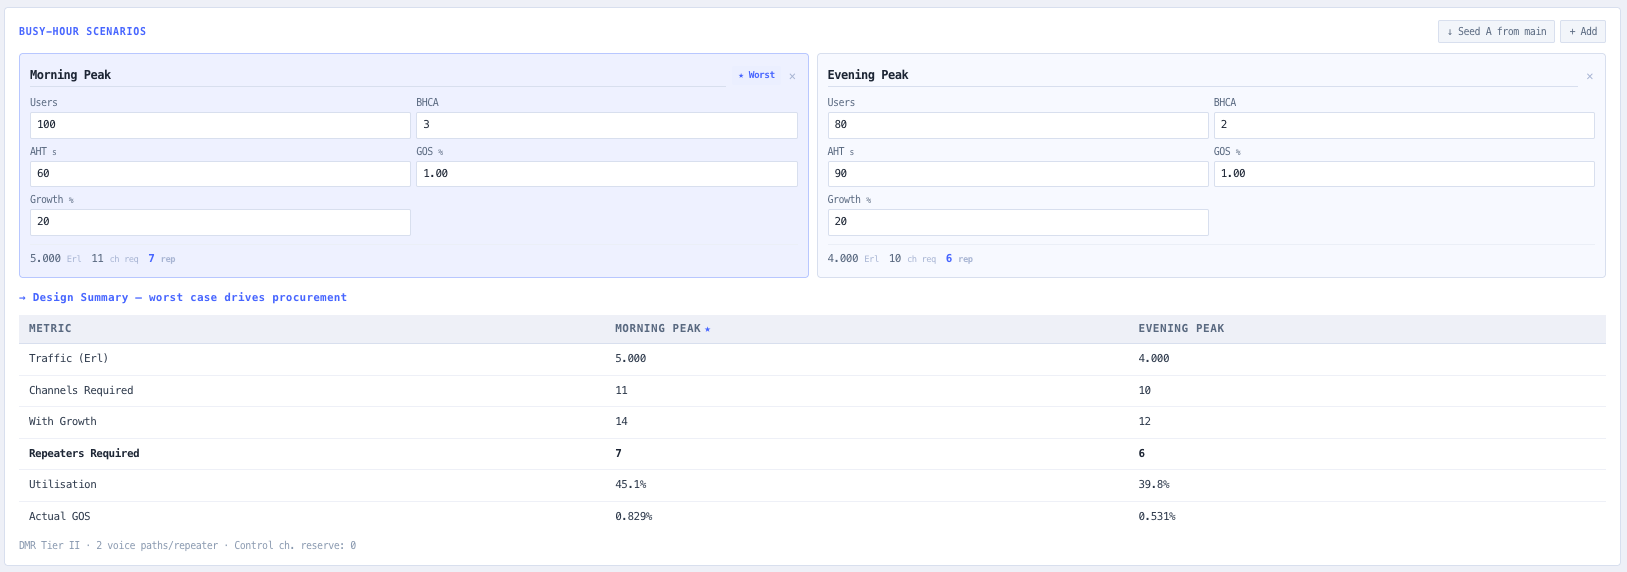
Define up to five named busy hour scenarios with independent user counts, BHCA, average hold time, grade of service targets, and growth margins. The comparison table shows offered traffic, required channels, channels with growth, repeaters, utilisation, and actual GOS side by side. The worst case scenario is automatically identified and flagged as the procurement driver, so the radio count on the order is the one that survives every realistic peak rather than just the average day.
Technology aware sizing
Channel to repeater translation is technology aware. P25 Phase I returns one channel per repeater. P25 Phase II returns two voice channels per repeater. DMR Tier II returns two voice channels per repeater. TETRA returns four channels per repeater. Analog returns one channel per repeater. Custom multipliers are supported. The output is a deployable repeater count rather than a raw channel number that still needs translating.
Reference Erlang B table and CSV export
A reference Erlang B table is built in for cross checking results against published values. CSV export captures the inputs, results, model comparison, sensitivity sweep, and scenario comparison so the analysis can be filed against the project, attached to a procurement document, or submitted with a spectrum licence application.