High Frequency Radio

Ionospheric Conditions Dashboard

A live, fully customisable space weather and HF propagation workspace built from over forty drag and drop widgets, powered by BOM SWS, NOAA SWPC, NASA DONKI, and the global ionosonde network.

Overview

HF propagation is driven by an ionosphere that is in constant motion. Solar flares, coronal mass ejections, geomagnetic storms, sporadic E events, and the daily diurnal cycle all change which frequencies will work between any two points on the planet right now. Operators who do not check current conditions before transmitting waste time, miss critical traffic, and sometimes commit safety of life communications to a band that is already closed.

The noIM₃ Ionospheric Conditions Dashboard consolidates everything an HF operator, emergency communications coordinator, or RF engineer needs to know about current space weather into a single configurable workspace. Rather than a fixed layout, the dashboard is a drag and drop canvas with over forty live widgets covering solar output, geomagnetic activity, ionospheric state, energetic particle flux, and derived HF propagation products. Every layout is persisted per user, so a DX operator, a maritime HF officer, an emergency communications volunteer, and a defence comms planner can each build a workspace that reflects their operational focus.

Data is sourced from authoritative feeds. The Australian Bureau of Meteorology Space Weather Services for the regional view, NOAA Space Weather Prediction Center for the global picture, NOAA DSCOVR for solar wind, GOES for X ray and EUV monitoring, NASA DONKI for CME and storm tracking, and the global ionosonde network for live foF2 and MUF(3000) readings. Automatic refresh, staleness detection (>15 min), a UTC clock, and a configurable alert engine that fires against user defined thresholds keep operators aware of data currency at all times.

Capabilities

Drag and drop widget canvas

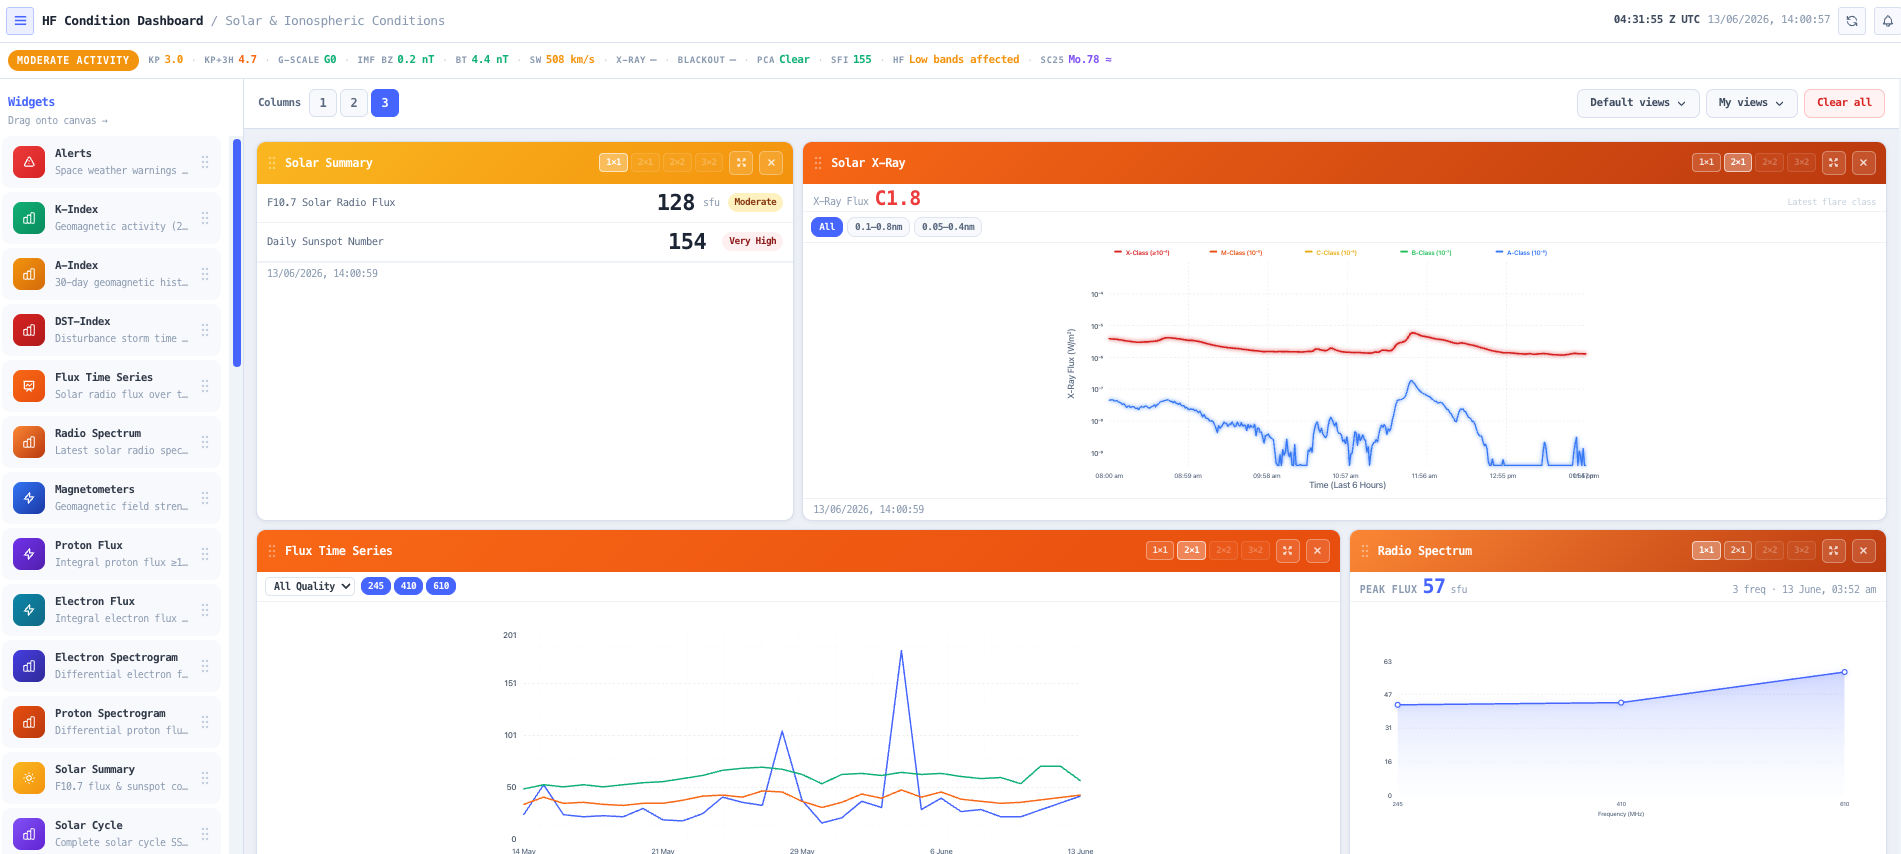
A configurable one, two, or three column grid lets you compose your own dashboard from the widget palette. Every tile supports four size presets (1x1, 2x1, 2x2, 3x2), drag to reposition, overlap detection, fullscreen expansion, and per widget refresh. Layouts are persisted per user.

Conditions summary banner and alerts

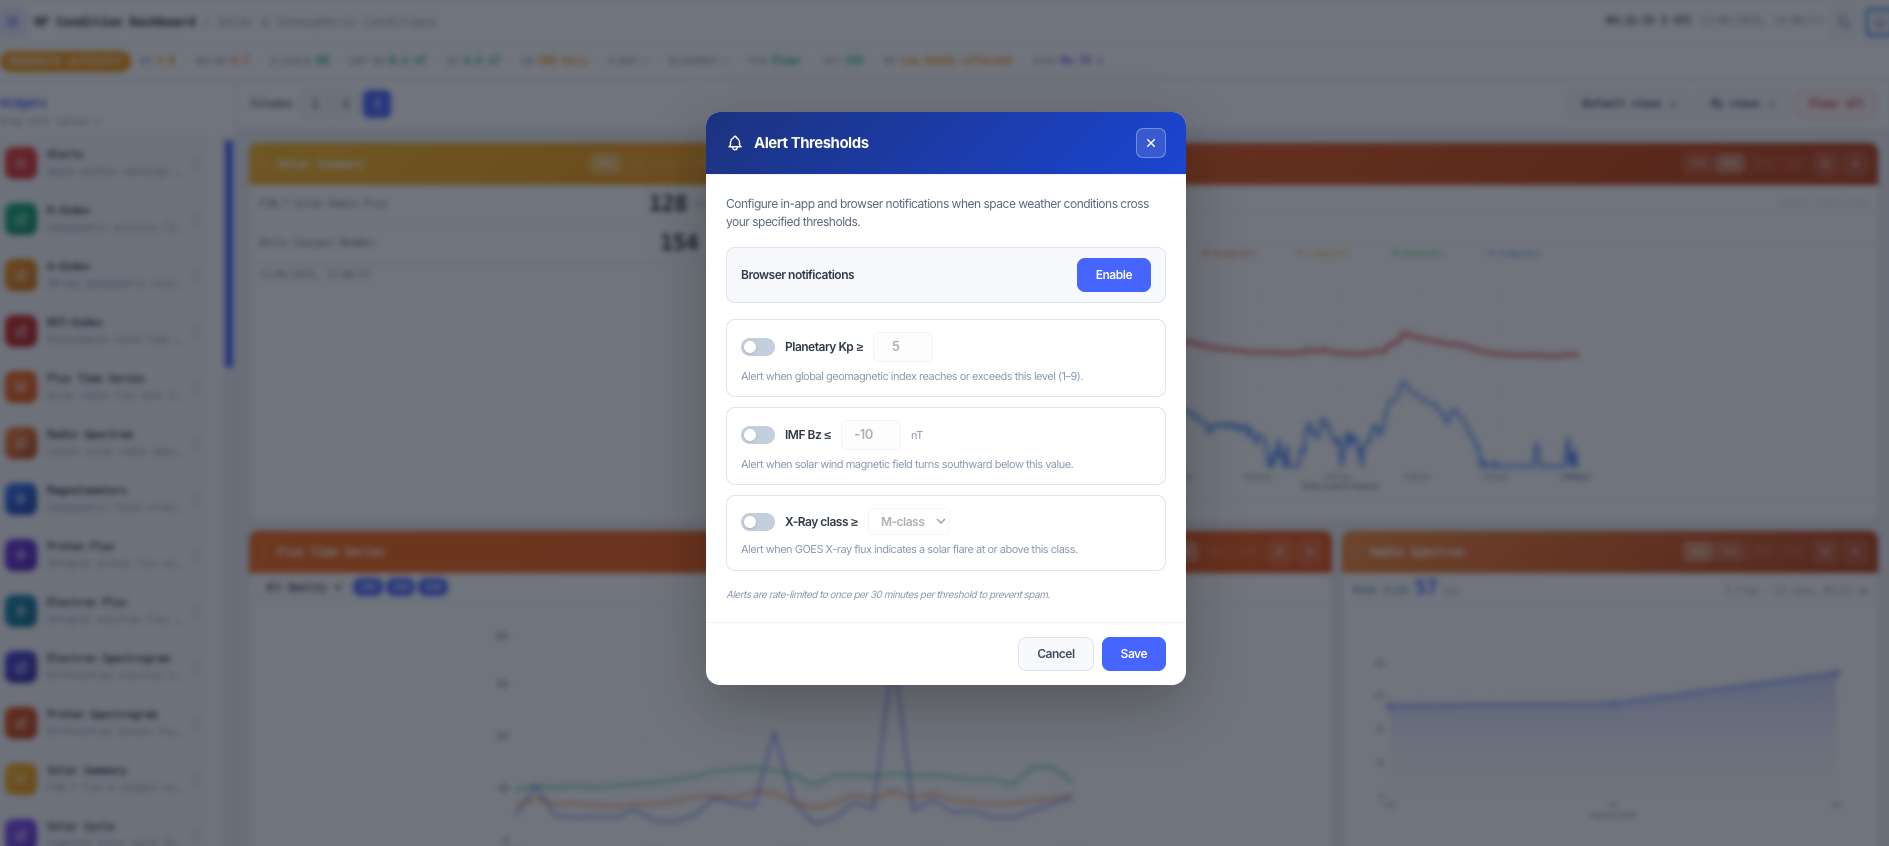
A top of page summary banner distils current solar, geomagnetic, and HF propagation state into an immediate go or no go read. User configurable alert thresholds (Kp, A index, X ray class, proton flux, Bz, solar wind speed) drive colour coded warnings and an integrated alerts panel that ingests NOAA SWPC watches, warnings, and advisories.

Solar activity suite

F10.7 solar radio flux observed against predicted, twenty year history, time series, and spectrum. Sunspot number, active regions with flare probabilities, GOES X ray flare monitoring, EUVS Lyman alpha and Mg II indices, and full solar cycle context. Together they give a complete picture of the solar drivers behind HF propagation.

Geomagnetic and space weather indices

K index over 24 hours, A index over 30 days, DST, planetary Kp seven day bar chart, Kp three day forecast with storm outlook, NOAA R, S, and G scales, magnetometer readings, and a geomagnetic activity map showing Kp driven auroral oval latitudes and affected HF path zones.

Ionospheric state and HF propagation

Live global foF2 ionospheric map (ITU model), ionosonde readings for foF2 and MUF(3000), HF band conditions from 160 m to 10 m derived from Kp and F10.7, D layer absorption and short wave fadeout impact, NVIS suitability with diurnal foF2 curve, sporadic E monitoring, band opening matrix (10 bands by 4 path types), and a point to point Path MUF planner.

Solar wind, CME, and particle environment

NOAA DSCOVR solar wind feed with IMF Bz, Bt, speed, and density. 24 hour Bz trend with storm onset annotations. Energetic proton (>=10 MeV) and electron (>=2 MeV) flux. Differential particle spectrograms for SEP events. NASA DONKI CME and storm tracker with predicted Kp arrival windows. NOAA OVATION aurora oval for polar path risk.

Operational planning tools

Grey line widget shows the day and night terminator with twilight enhancement band for DX planning. NOAA advisories surfaces plain text SWPC watches, warnings, alerts, and summaries. UTC clock, staleness badge, and background refresh indicator keep operators aware of data currency at all times.

Path MUF planner

Drop in transmit and receive coordinates and the dashboard returns MUF, LUF, OWF, and a suggested band list for the current ionosphere. Useful for a fast pre flight check on a specific circuit without leaving the situational awareness view.

Standards & methodology

  • ITU P.533. HF sky wave propagation prediction (used for derived MUF and band condition products)
  • ITU P.1239. CCIR ionospheric reference and global foF2 map
  • NOAA SWPC R, S, and G storm scales
  • BOM Space Weather Services regional warnings and alerts
  • NASA DONKI CME and geomagnetic storm catalogue

When to use this tool

  • HF link pre flight check before mission critical voice or data transmission
  • Emergency communications and HF ALE network monitoring
  • NVIS deployment planning for short to medium range tactical links
  • DX and long haul HF path planning using grey line and MUF products
  • Polar and high latitude path risk assessment during geomagnetic storms
  • Real time monitoring of short wave fadeout during solar flares
  • Long term HF system planning using solar cycle context and trends
  • Situational awareness for defence, maritime, and aviation HF operators
  • Resource sector and pastoral HF network monitoring
  • Maritime HF watch operations and weather routing decisions
  • Amateur radio contest and DXpedition condition tracking
  • Training new HF operators on the link between space weather and band openings

Is this the right tool for you?

Reach for the Ionospheric Conditions Dashboard in any of the following situations.

  • You are about to transmit a mission critical HF voice or data call and need a fast check on whether the band you have planned to use is actually open right now.
  • You are coordinating an emergency communications net or HF ALE network and need a single screen that tells you the current band condition, geomagnetic state, and any active alerts.
  • You are deploying a tactical NVIS link for short to medium range communications and want to confirm that foF2 supports the operating frequency.
  • You are planning a long haul DX or backup HF circuit and need the grey line terminator position and current MUF along the path.
  • You operate over polar or high latitude paths and need to know whether the aurora oval has expanded enough to put your route at risk.
  • You are monitoring a working HF network during a solar flare and need to track short wave fadeout impact in real time as it develops.
  • You are planning HF system upgrades or fleet refresh decisions and need long term solar cycle context to justify equipment, antenna, and frequency choices.
  • You are responsible for defence, maritime, or aviation HF watch operations and need persistent situational awareness without rebuilding the view every shift.
  • You manage a pastoral or resource sector HF network in remote Australia and need a regionally sourced view that includes BOM Space Weather Services warnings.
  • You are running an HF contest, DXpedition, or special event station and want a custom dashboard that highlights bands and paths relevant to your operating plan.
  • You are responding to a geomagnetic storm forecast and need to compare predicted Kp arrival windows against your scheduled traffic.
  • You are training new HF operators or RF engineers and want a teaching environment that connects raw space weather data to actual band openings.
  • You need to set custom alerts so that you are paged when Kp, X ray flare class, proton flux, or solar wind speed cross thresholds that affect your specific operations.
  • You are conducting a post incident review of an HF outage and want to overlay the historical solar, geomagnetic, and ionospheric state against the time of the failure.
  • You are validating that a planned HF schedule will hold up across the next 24 hours and need MUF, LUF, and Kp forecasts in one workspace.
  • You operate from a fixed Australian site and want a workspace that defaults to BOM SWS regional data rather than a global average.

Frequently asked questions

Where does the data come from?

BOM Space Weather Services for the Australian regional view, NOAA Space Weather Prediction Center for the global picture, NOAA DSCOVR for solar wind, GOES for X ray and EUV, NASA DONKI for CME and storm tracking, and the global ionosonde network for live foF2 and MUF(3000) readings. Each widget is annotated with its source and a staleness indicator fires if data is more than 15 minutes old.

How customisable is the layout?

Fully. The canvas supports a one, two, or three column grid, and every tile has four size presets (1x1, 2x1, 2x2, 3x2). You can drag tiles to reposition, expand any tile to fullscreen, and the layout is persisted per user so your workspace is restored on every visit.

Can I configure my own alerts?

Yes. Alert thresholds for Kp, A index, X ray flare class, proton flux, Bz, and solar wind speed are user configurable. When a threshold is crossed the summary banner changes colour and the alerts panel surfaces the event together with any related NOAA SWPC watch, warning, or advisory.

Does it include a propagation prediction for a specific path?

Yes. The path MUF planner widget takes transmit and receive coordinates and returns MUF, LUF, OWF, and a suggested band list against the current ionosphere. For a full ITU P.533 link prediction with link budget and reliability you would use the noIM₃ HF Link Planner, which integrates with this dashboard for a complete workflow.

How is HF band condition derived?

Band conditions across 160 m to 10 m are derived from current Kp and F10.7 against the diurnal cycle and seasonal context, then summarised into a band by path type matrix (day, night, short path, long path) so an operator can see at a glance which bands are likely to be open and to where.

Is the dashboard suitable for operations during geomagnetic storms?

Yes. The dashboard is built around storm awareness. Kp forecast, NOAA G scale, DSCOVR solar wind, IMF Bz with storm onset annotations, NASA DONKI CME tracker with predicted arrival windows, OVATION aurora oval, and proton flux are all first class widgets, with alerts wired to the indices that matter for your operations.

Can I use this for NVIS planning?

Yes. The NVIS suitability widget plots the diurnal foF2 curve at your location and indicates whether the operating frequency is supported by the current and forecast ionosphere for short to medium range tactical links.