The ACMA register of radiocommunications licences on an interactive map, with full site records, interference and frequency reuse screens, point to point link analysis, site reports and a licence portfolio.
Included in the 14-day Pro trial on every new account. No credit card.
ACMA Database Map
7 inputs→10 outputs
Walkthrough
See it working
ACMA Database Map1 / 17
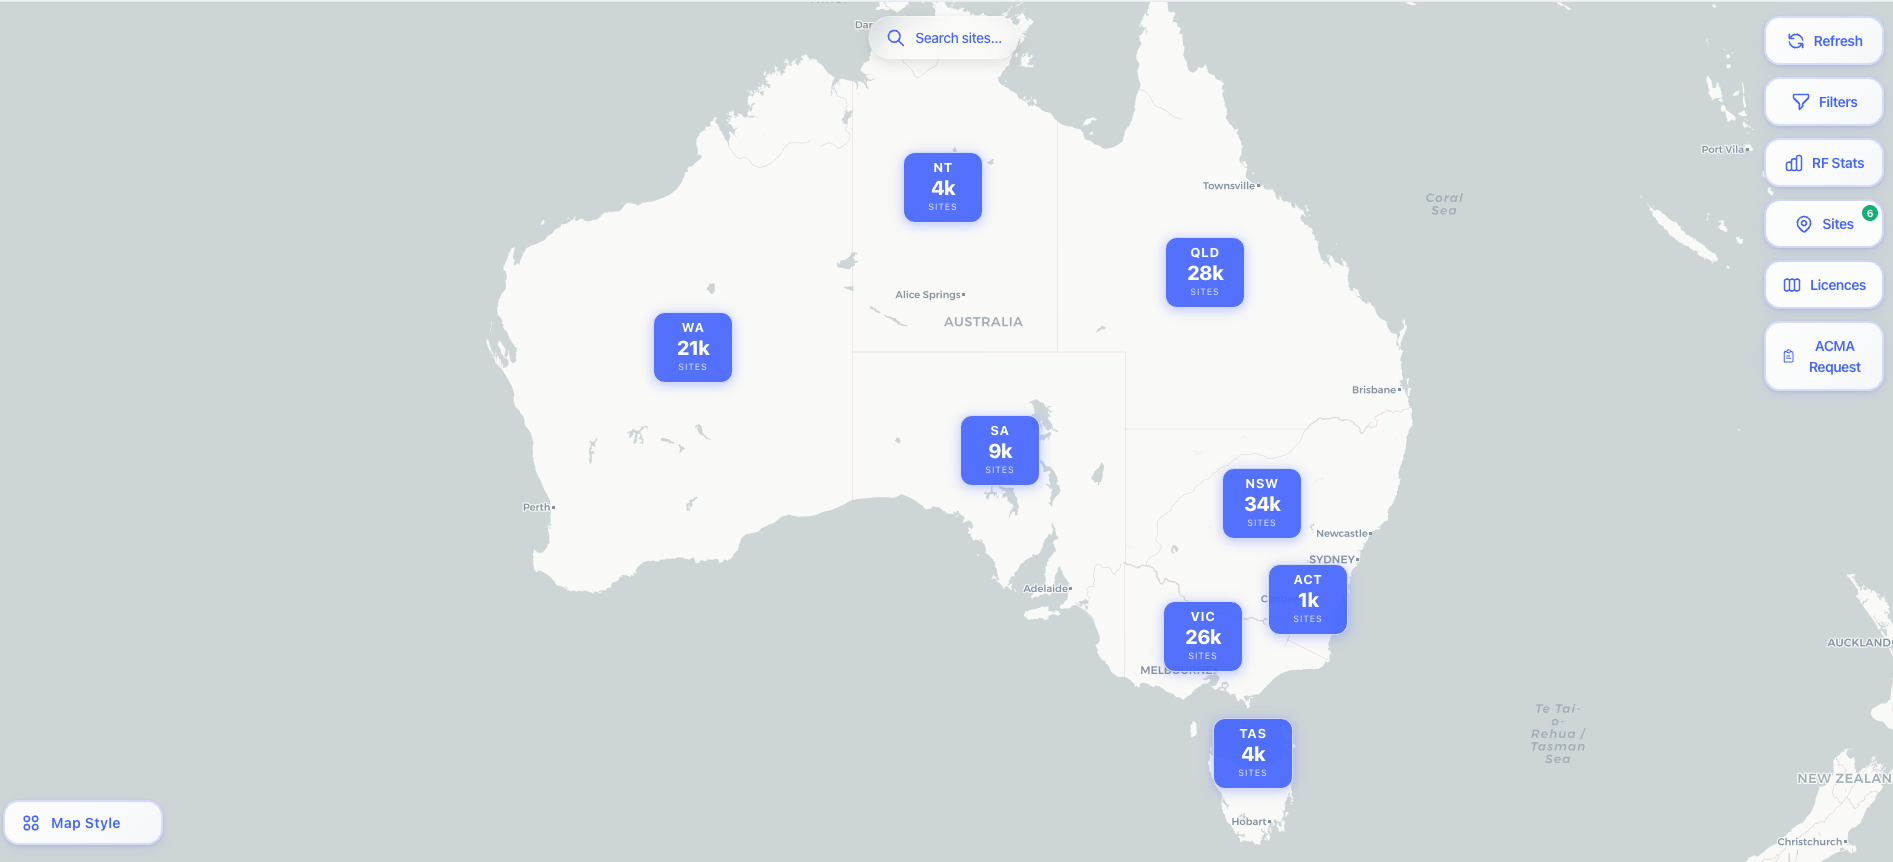
Clustered markers across Australia, resolving to sites as you zoom in.
Overview
What the ACMA Database Map does
The ACMA Register of Radiocommunications Licences is the public record of the licences issued in Australia: the sites, the frequencies assigned at each, the equipment and antennas, the licensees and the expiry dates. For an engineer planning a deployment, investigating interference or managing a fleet of licences, it is the starting point. The official search is built for looking up records rather than seeing them in place, so the map puts the same data where engineers think about it.
Read the full overview
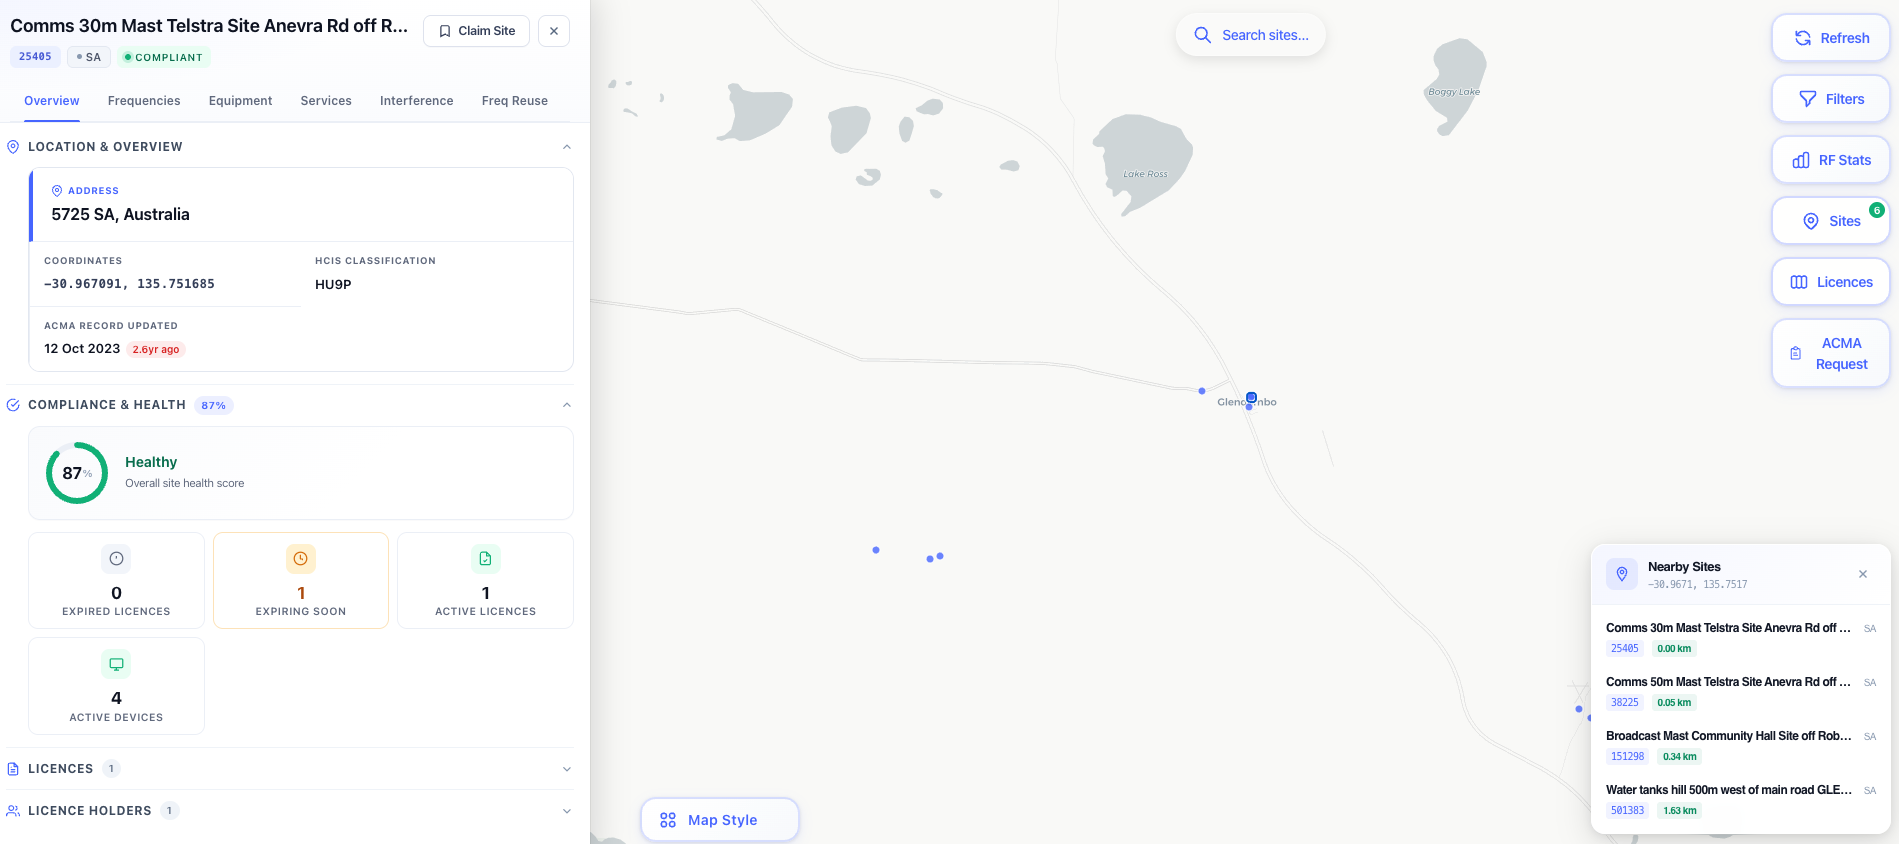
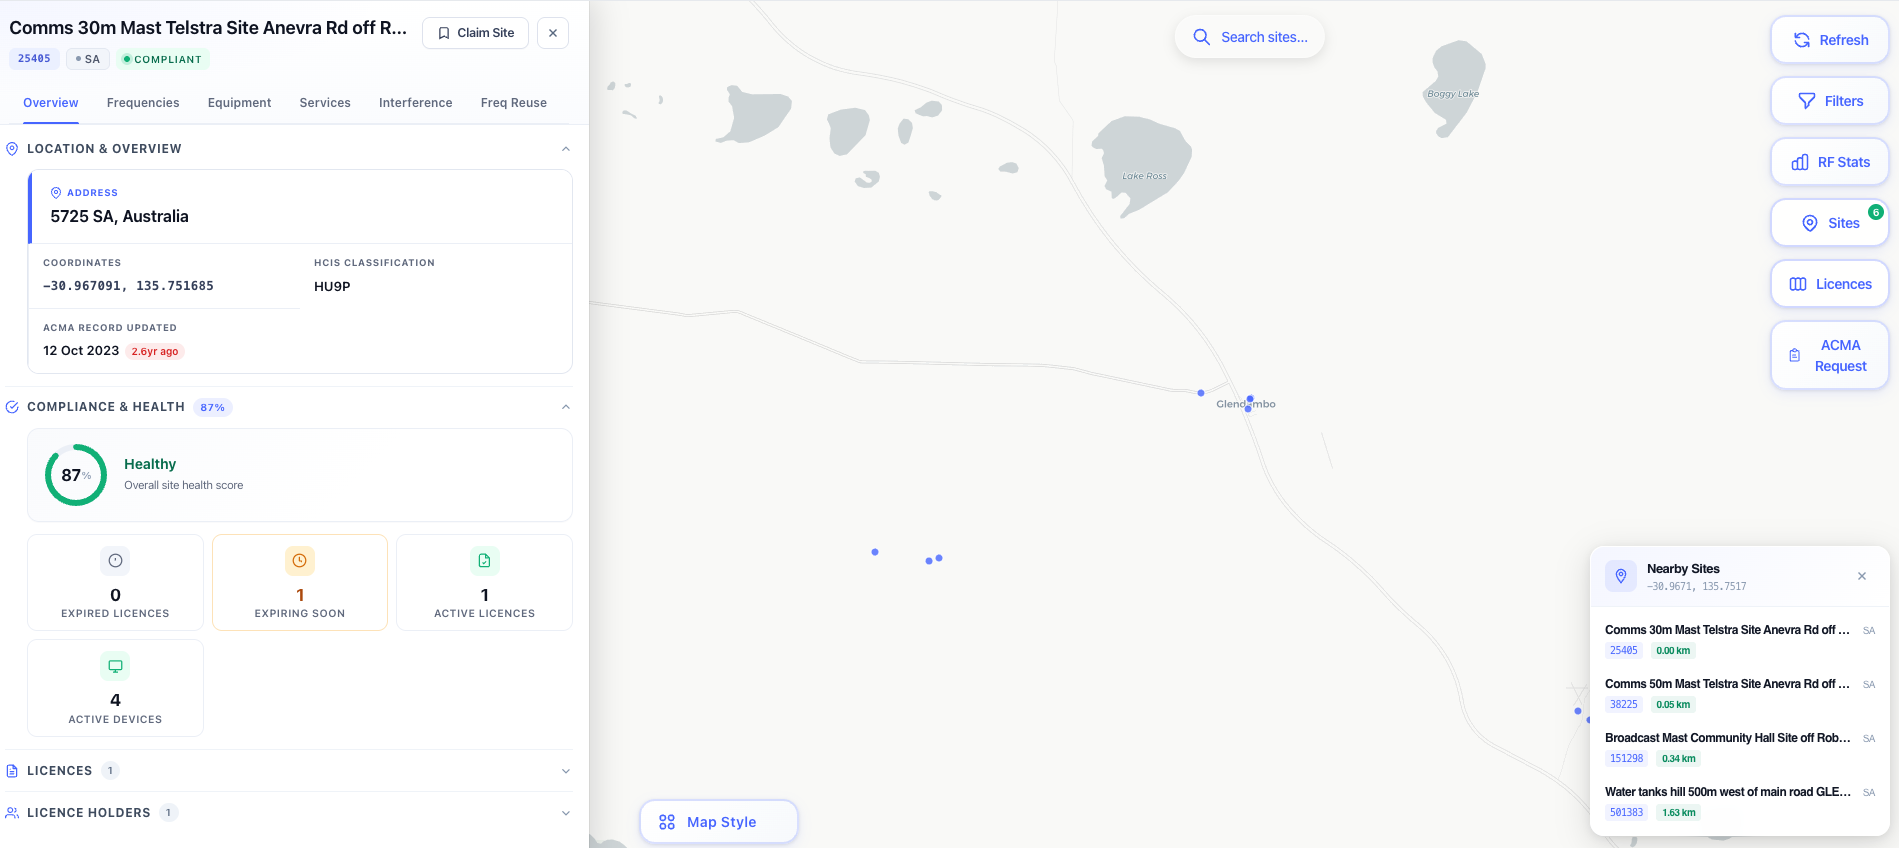
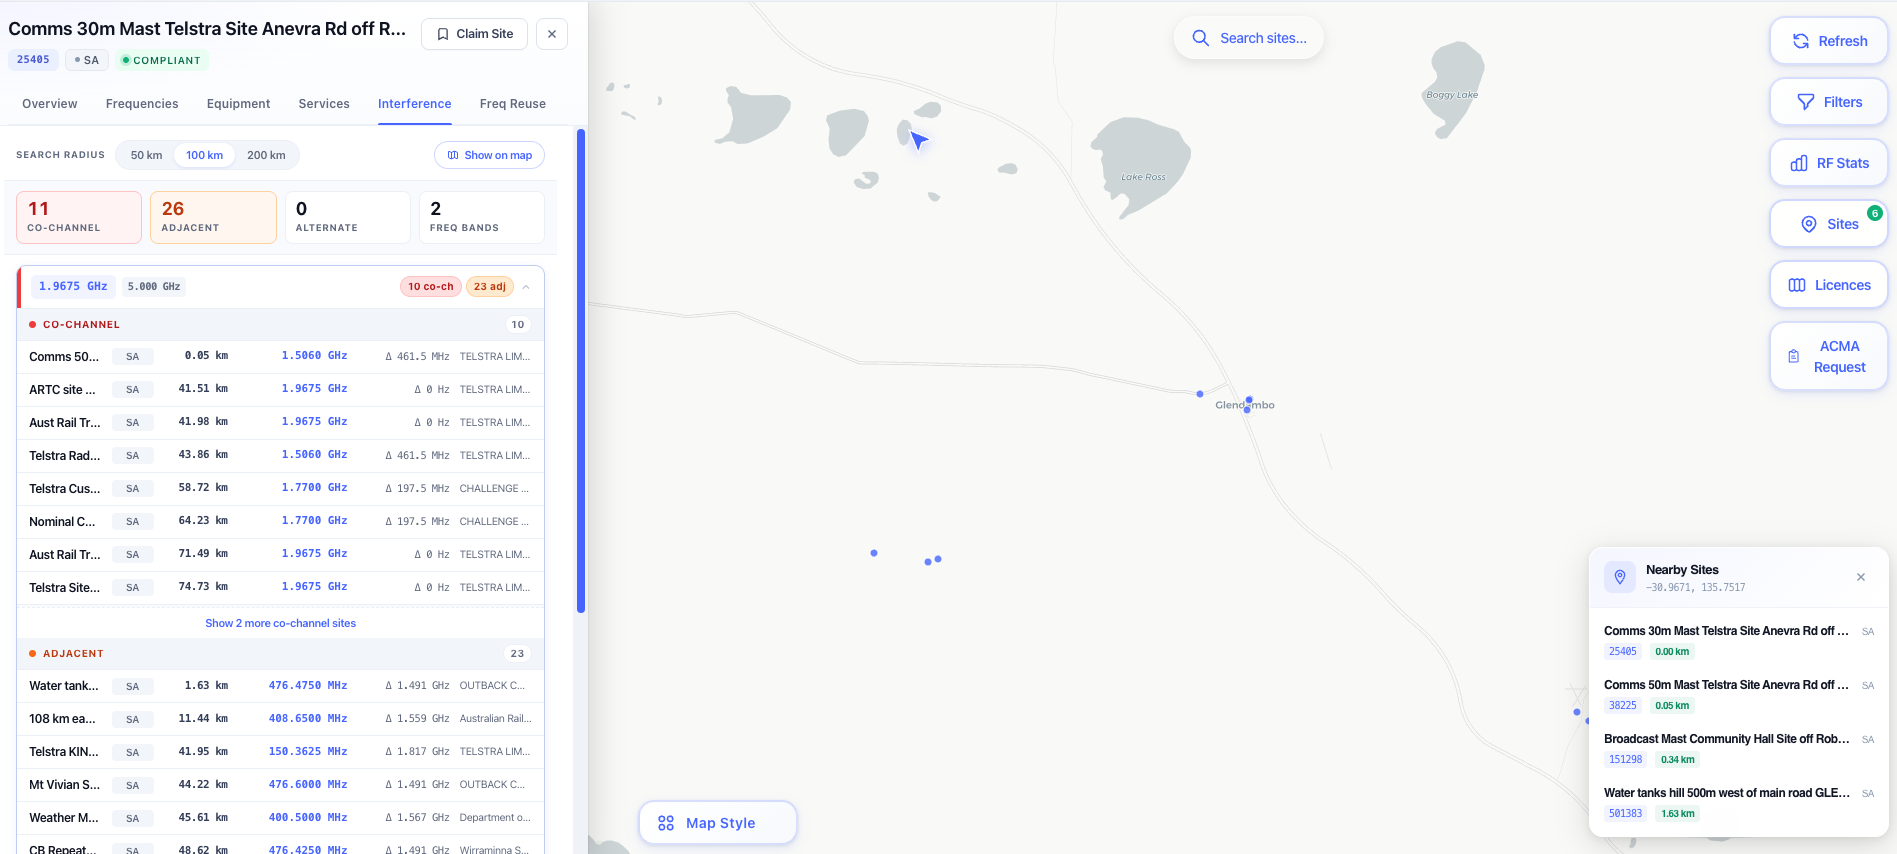
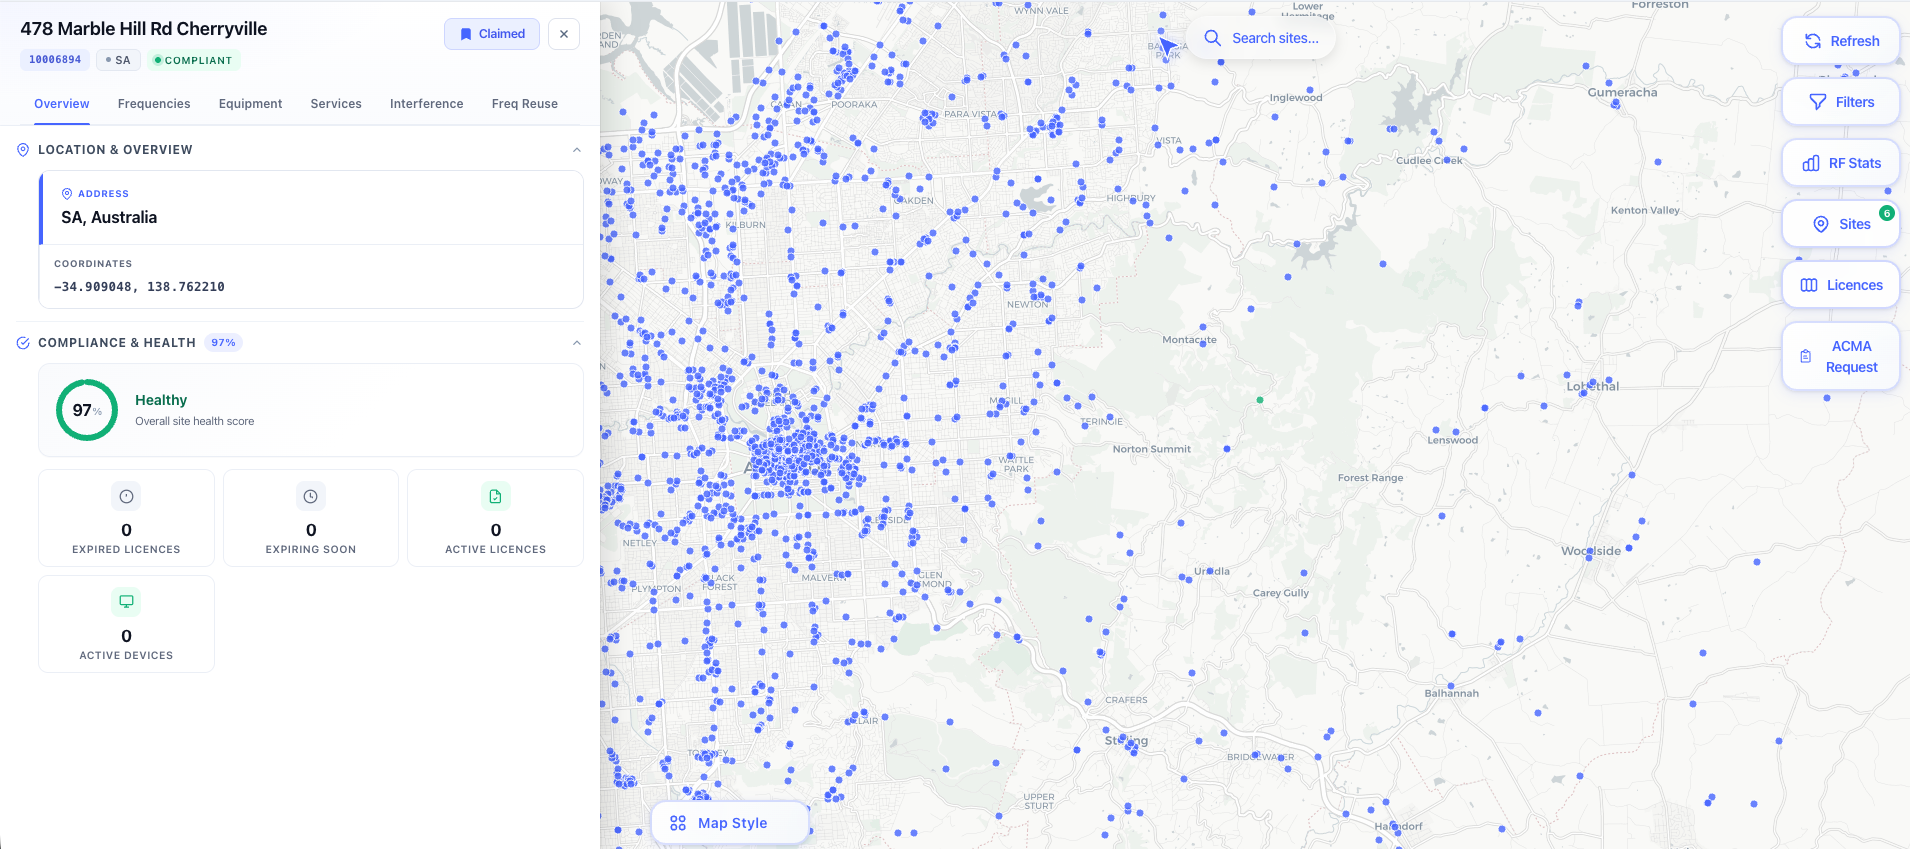
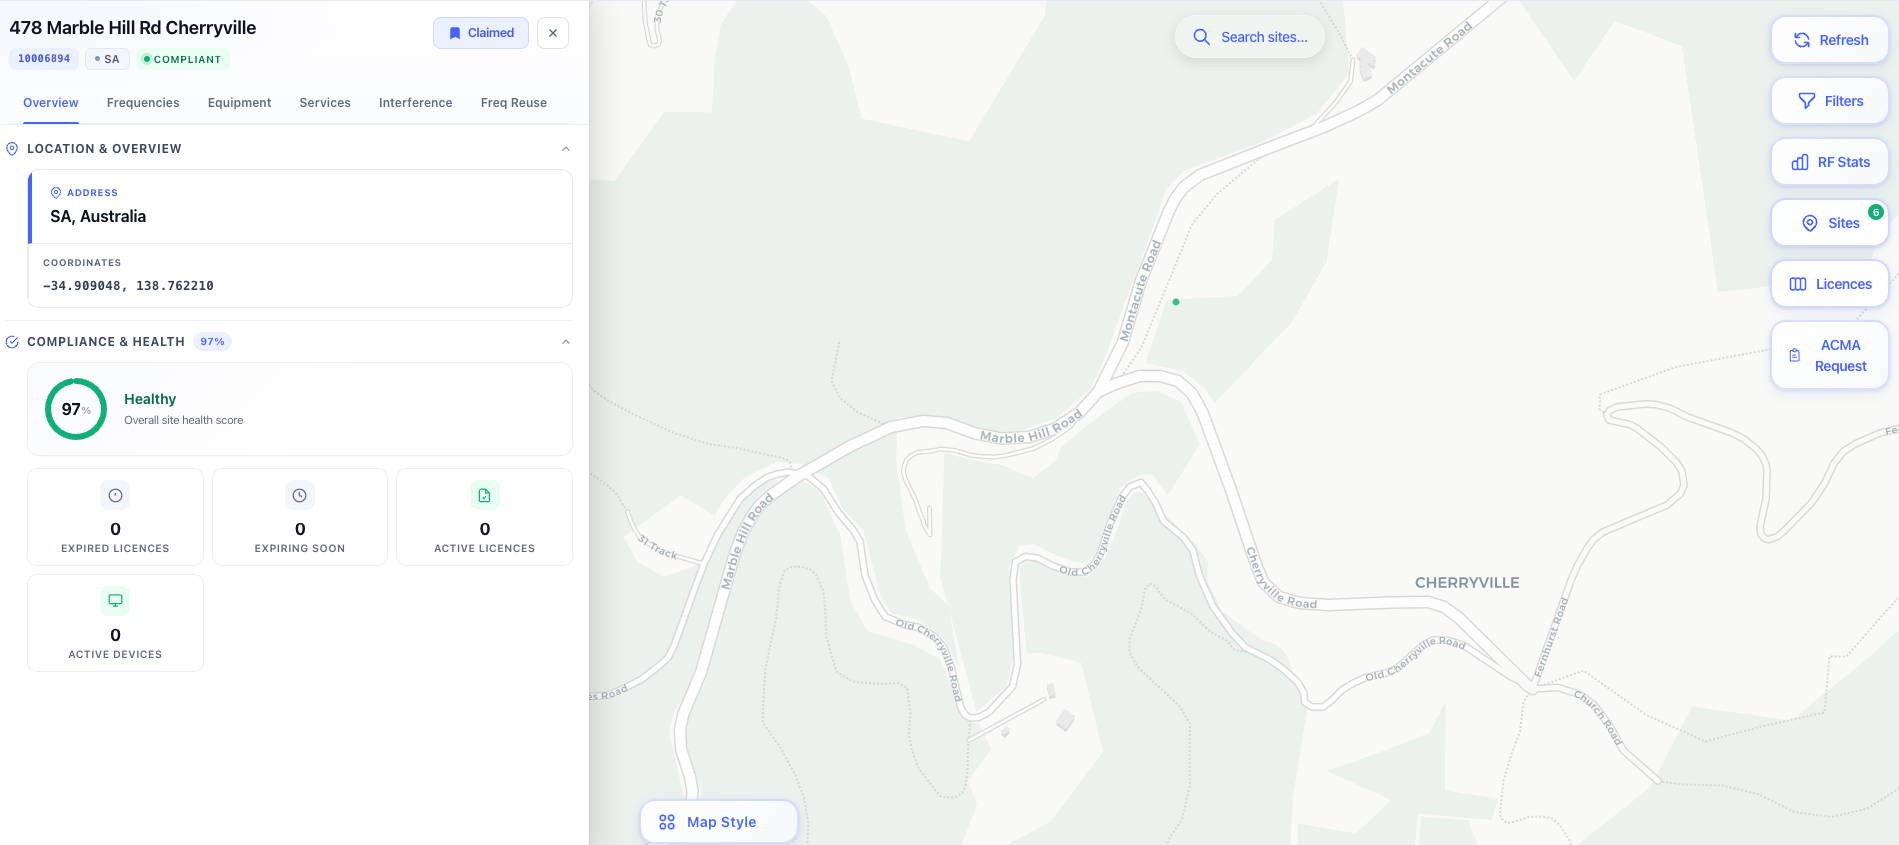
The ACMA Database Map shows every registered site as a marker, with clusters that resolve to individual sites as you zoom in. Opening a site shows its licence holders and status, every frequency with its emission and power, the transmitters, receivers and antennas, and its neighbours. The Interference tab lists co-channel, overlapping and adjacent channel neighbours with the antenna discrimination between the two ends, and the Frequency Reuse tab grades co-channel pairs in the land mobile bands against the RALI LM 08 separation for their band. Both take the register at face value and give a shortlist of pairs worth assessing, not a coordination.
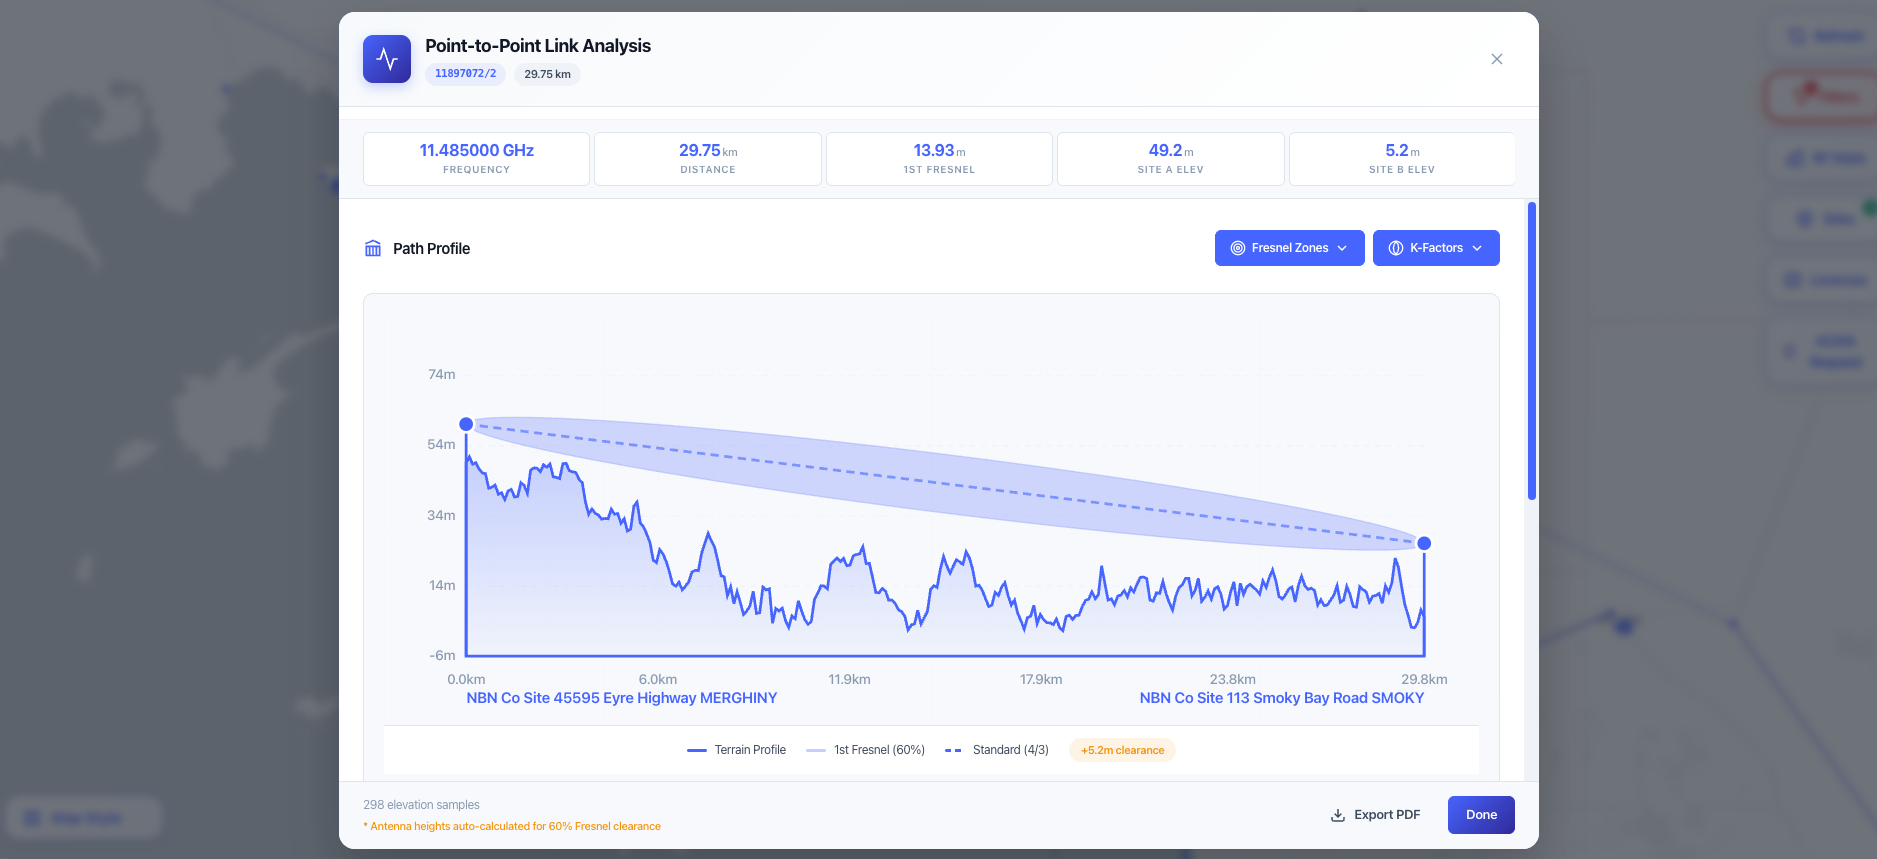
Registered point to point links are drawn on the map, and each can be opened for a link budget on its registered values, path clearance, rain and gas loss from ITU-R recommendations, and a screen of nearby transmitters against the RALI FX 3 protection ratios. A site can be turned into a PDF report, claimed into a licence portfolio or exported as CSV. The map is built on a dated snapshot of the register, with the date and its age always on screen.
Capabilities 8
The register on a map
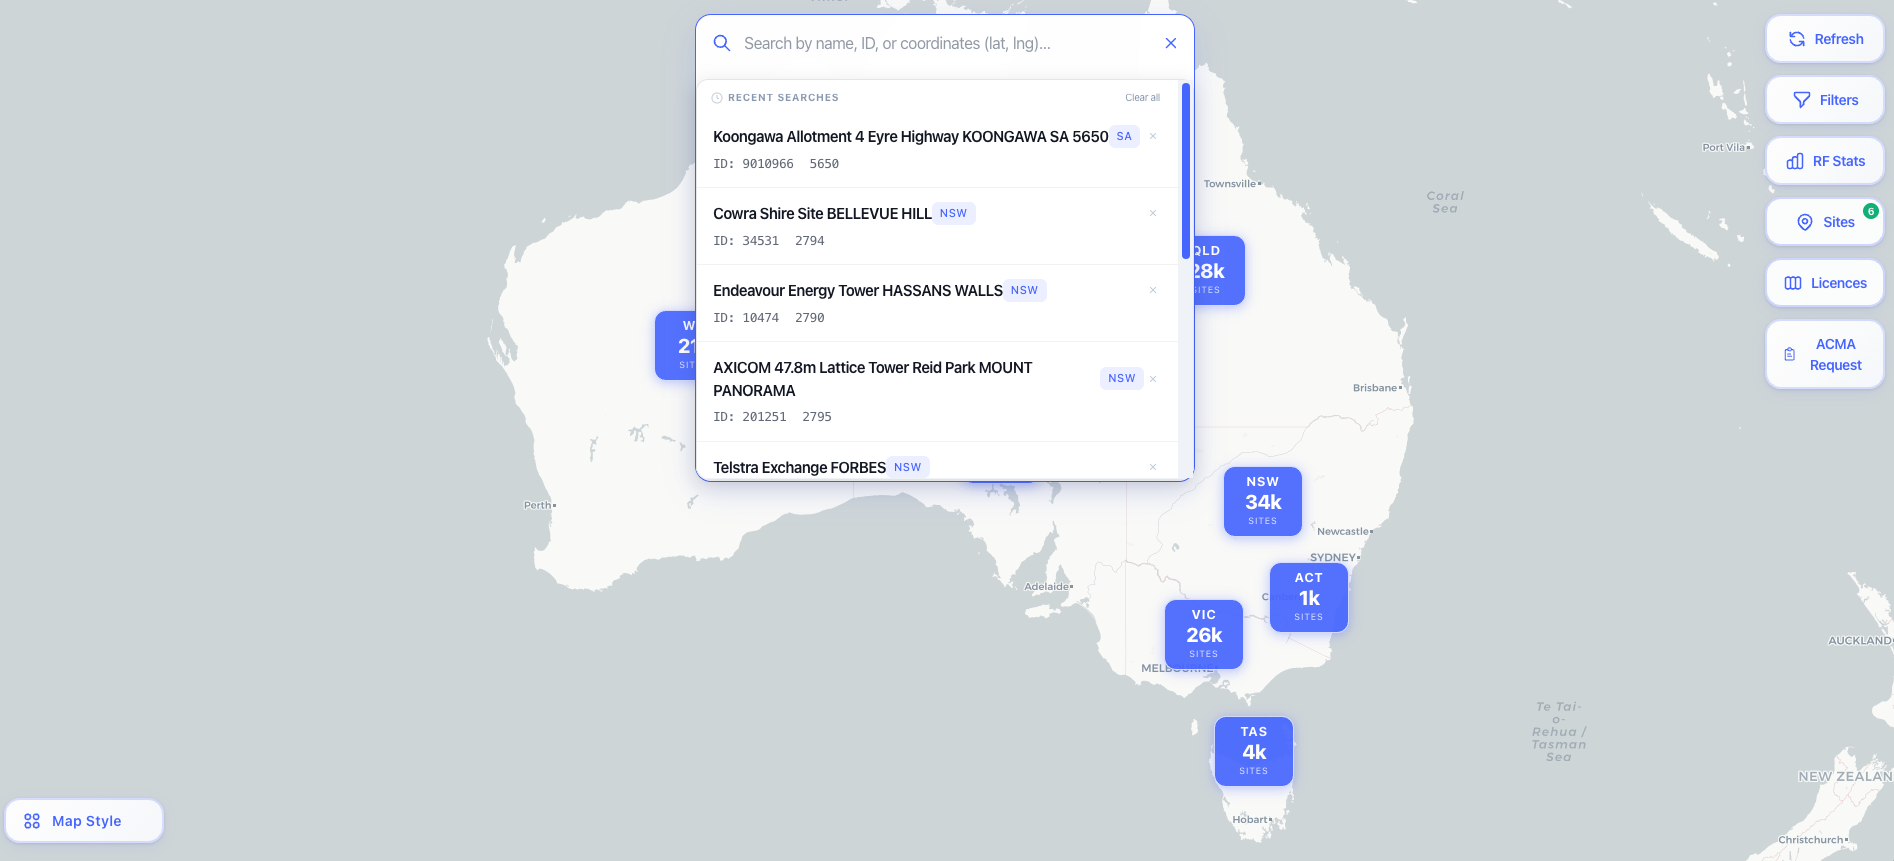
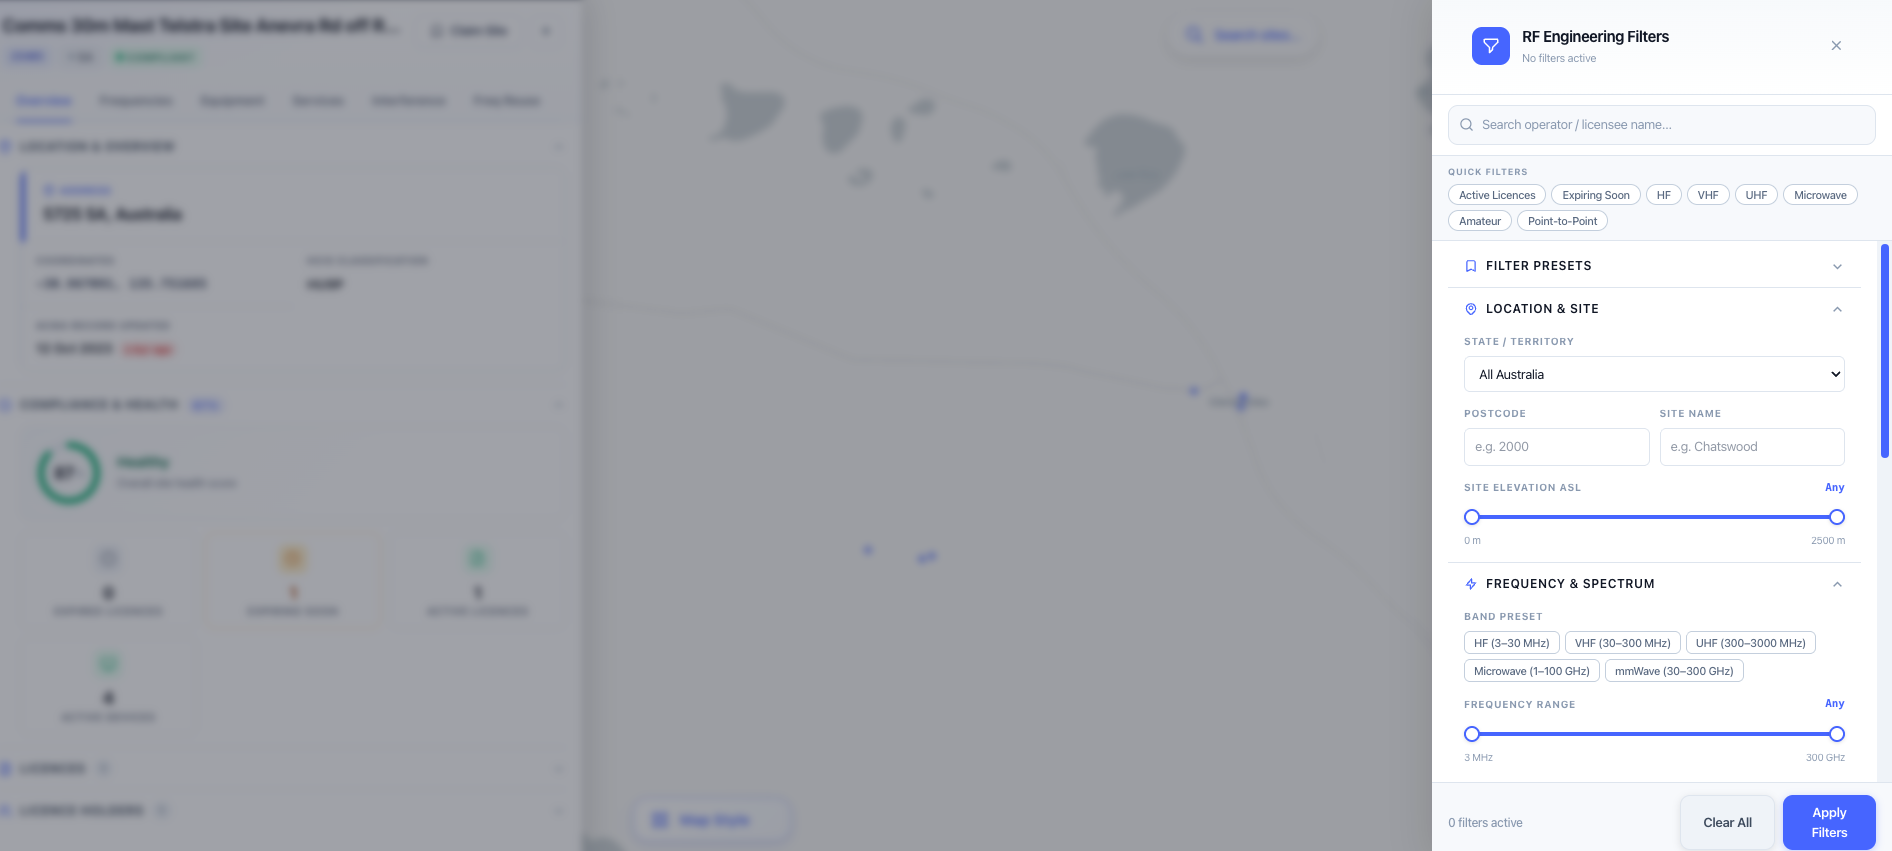
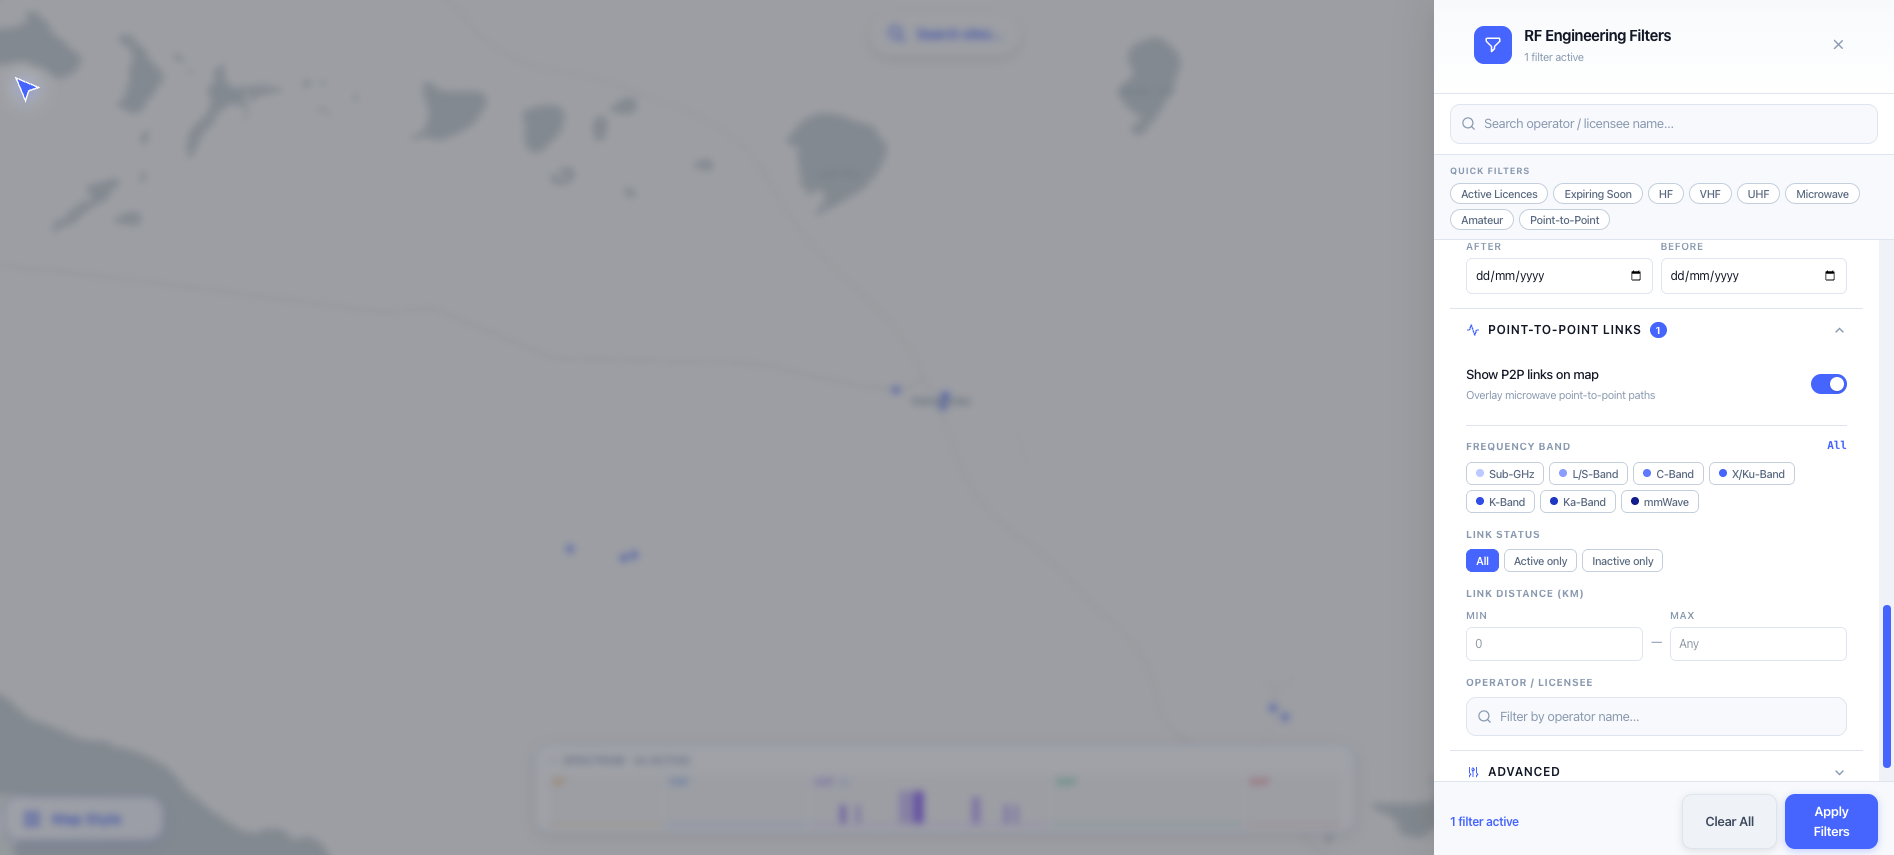
Licensed sites appear as clustered markers that resolve to individual sites as you zoom in. Search by name, site ID, licence, postcode or coordinates, list every site within a radius of a point, and narrow the map with filters for location, frequency, bandwidth, emission, power, EIRP, polarisation, licence status, expiry and licensee. Every view is kept in the URL, so it can be shared or bookmarked.
A full record for every site
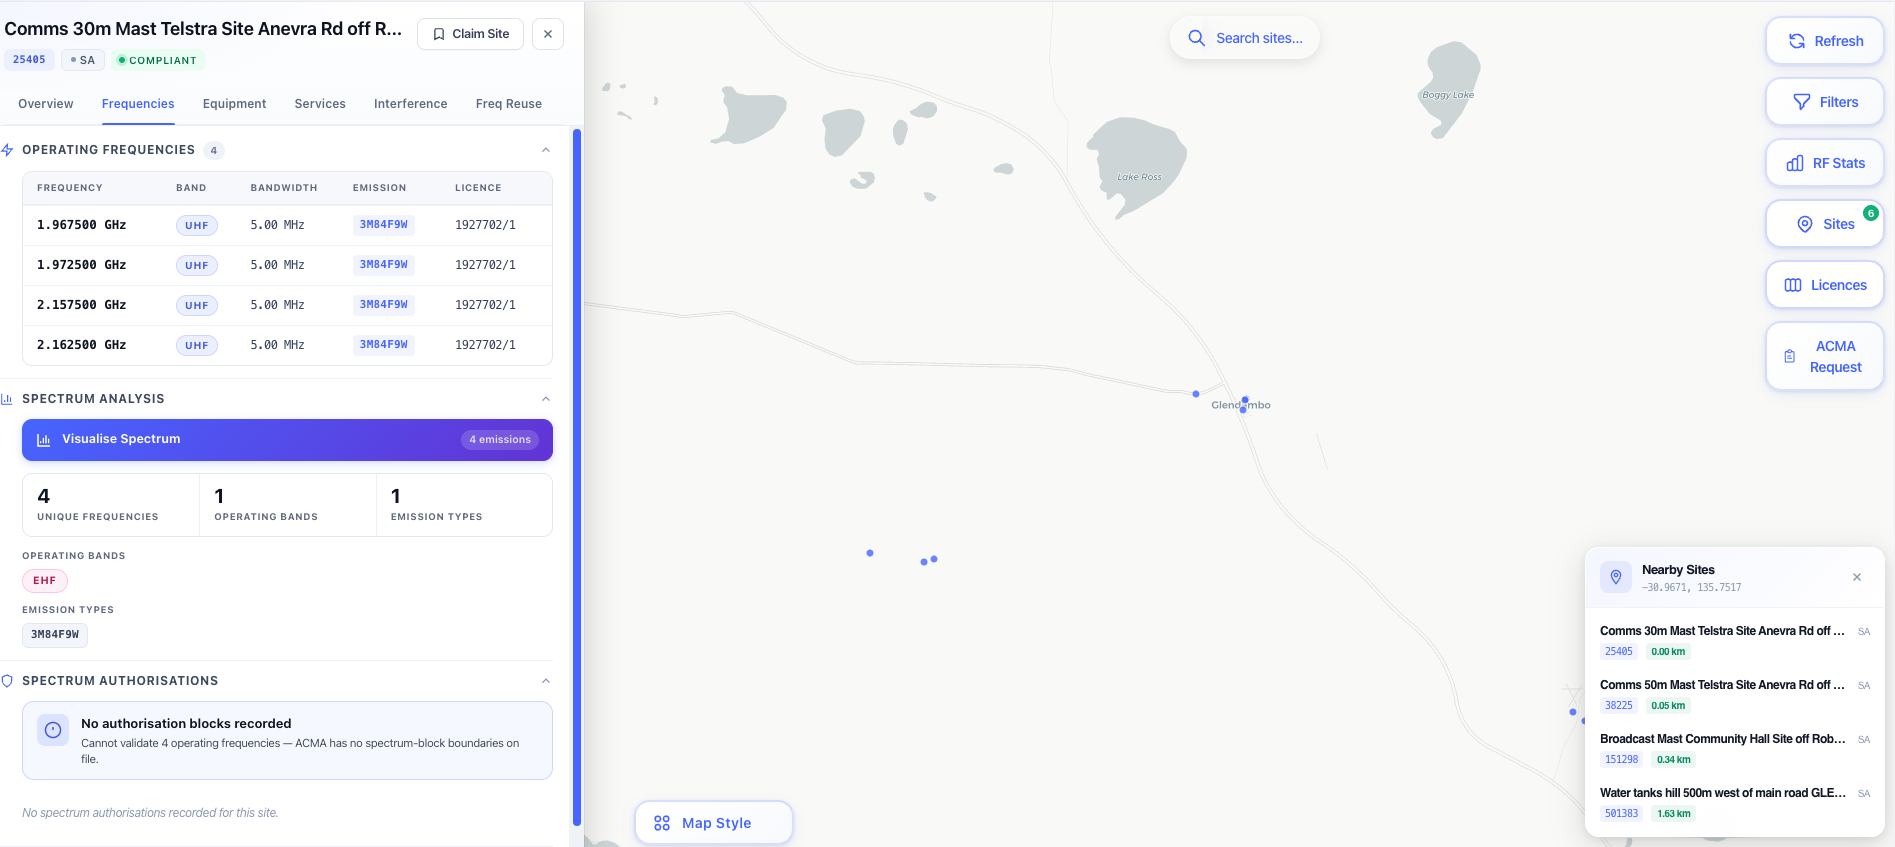
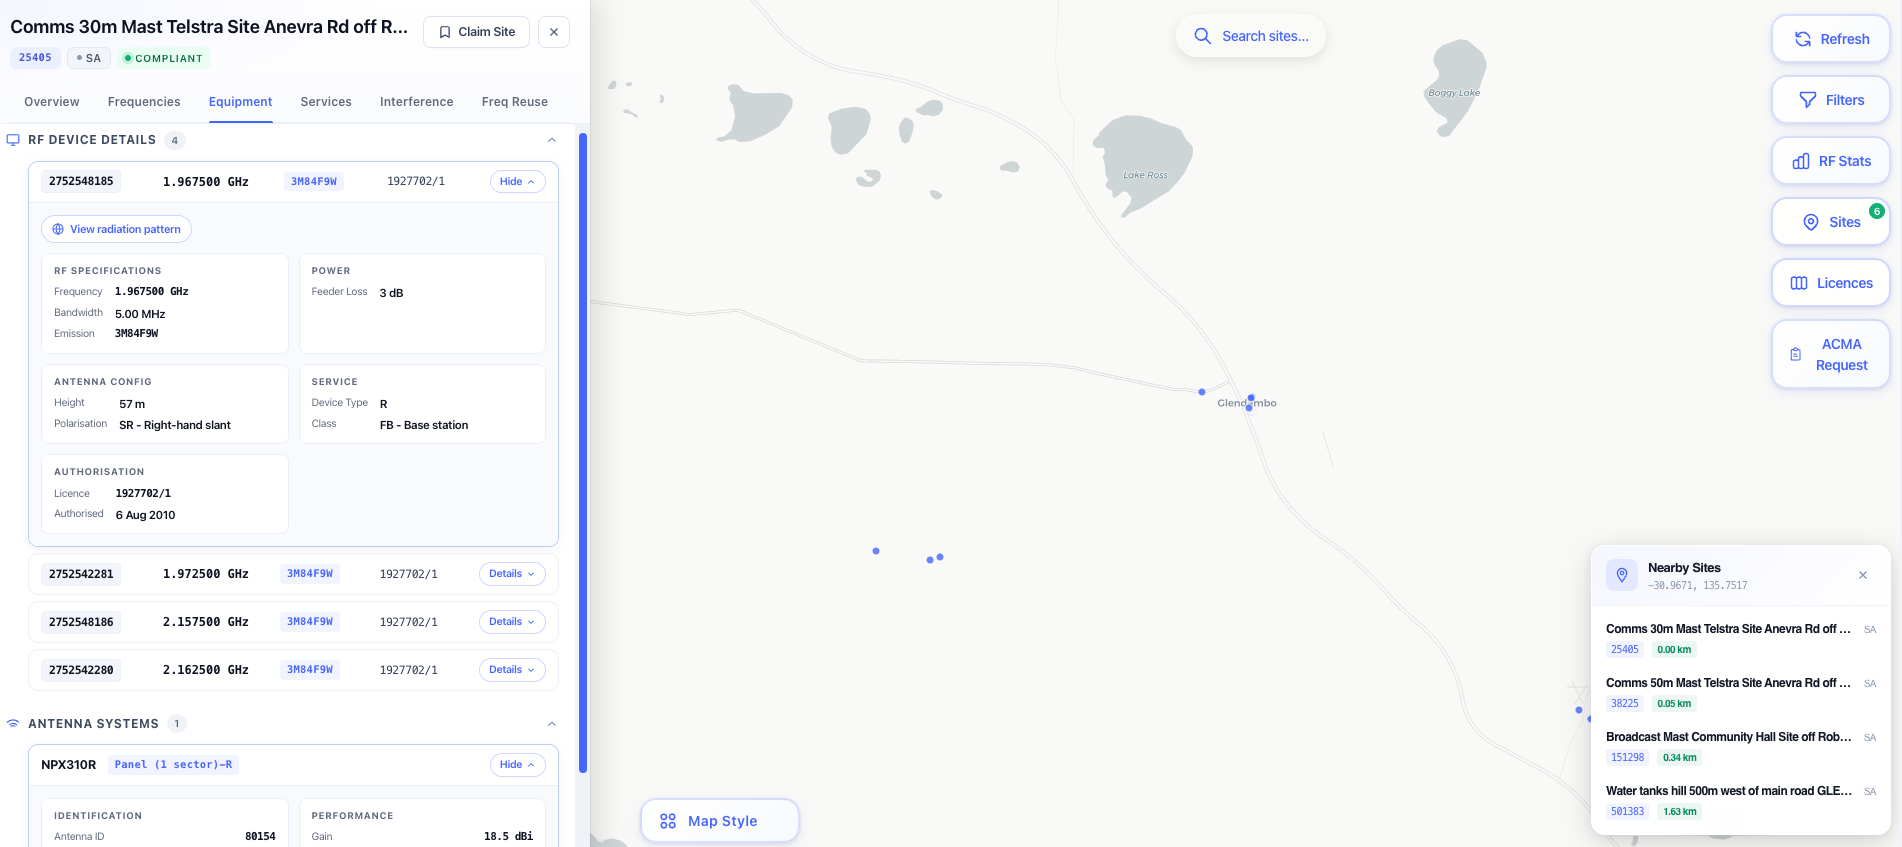
Opening a site shows its overview, frequencies, equipment and antennas, with a spectrum plot of the transmitters at their registered power. Antenna records open to the pattern the register holds, and values the register does not carry are shown as not recorded rather than filled in.
Interference and frequency reuse screens
The Interference tab lists co-channel, overlapping and adjacent channel neighbours within a radius, with the distance and the antenna discrimination between the two ends. The Frequency Reuse tab grades co-channel pairs in the land mobile bands against the RALI LM 08 separation for their band. Both are shortlists of pairs worth assessing, not a clearance.
Point to point link analysis
Registered links are reconstructed from the register and drawn on the map, and can be filtered by band. Each link opens to both end sites and a link budget on its registered values, with path clearance, rain and gas loss from ITU-R methods and assumed inputs labelled as such. Nearby transmitters are screened against the RALI FX 3 protection ratios over free space, then with terrain diffraction on the paths that fail.
Site reports
A site can be turned into a PDF report with a CSV of its findings, covering a register audit, frequency analysis, assignment feasibility, licensing review, co-location and tenancy, or fleet technology. Every finding states how much of the site the check could evaluate, and no report is a compliance certificate. A saved report flags when the register has changed for that site.
Channel finder
The channel finder sweeps a band and duplex split around a point and reports what the register holds on each channel and the channels either side, with candidate pairs ranked worst case first. It never describes a channel as available, because what can be licensed depends on matters the register does not carry.
Portfolios, fleets and studies
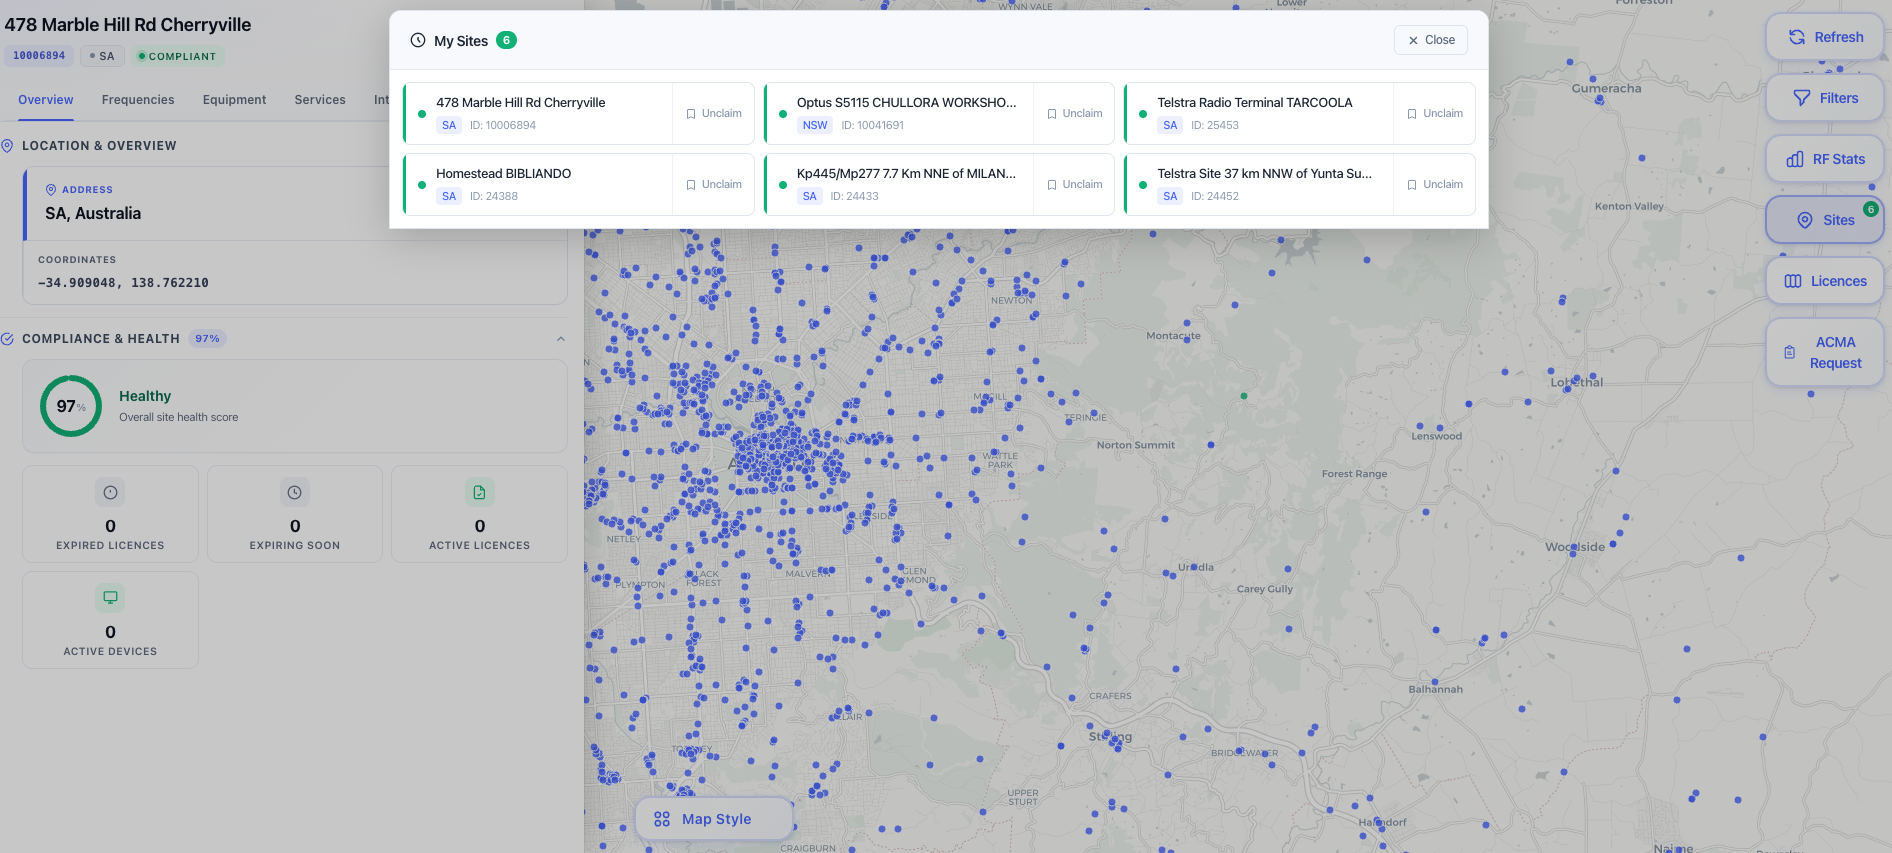
Sites can be claimed into a private portfolio with a dashboard of every licence grouped by how soon it expires. A fleet view lays an operator's sites against its channels to show where a channel is missing, and studies run a single report across a set of sites or candidate locations.
Statistics, export and hand-off
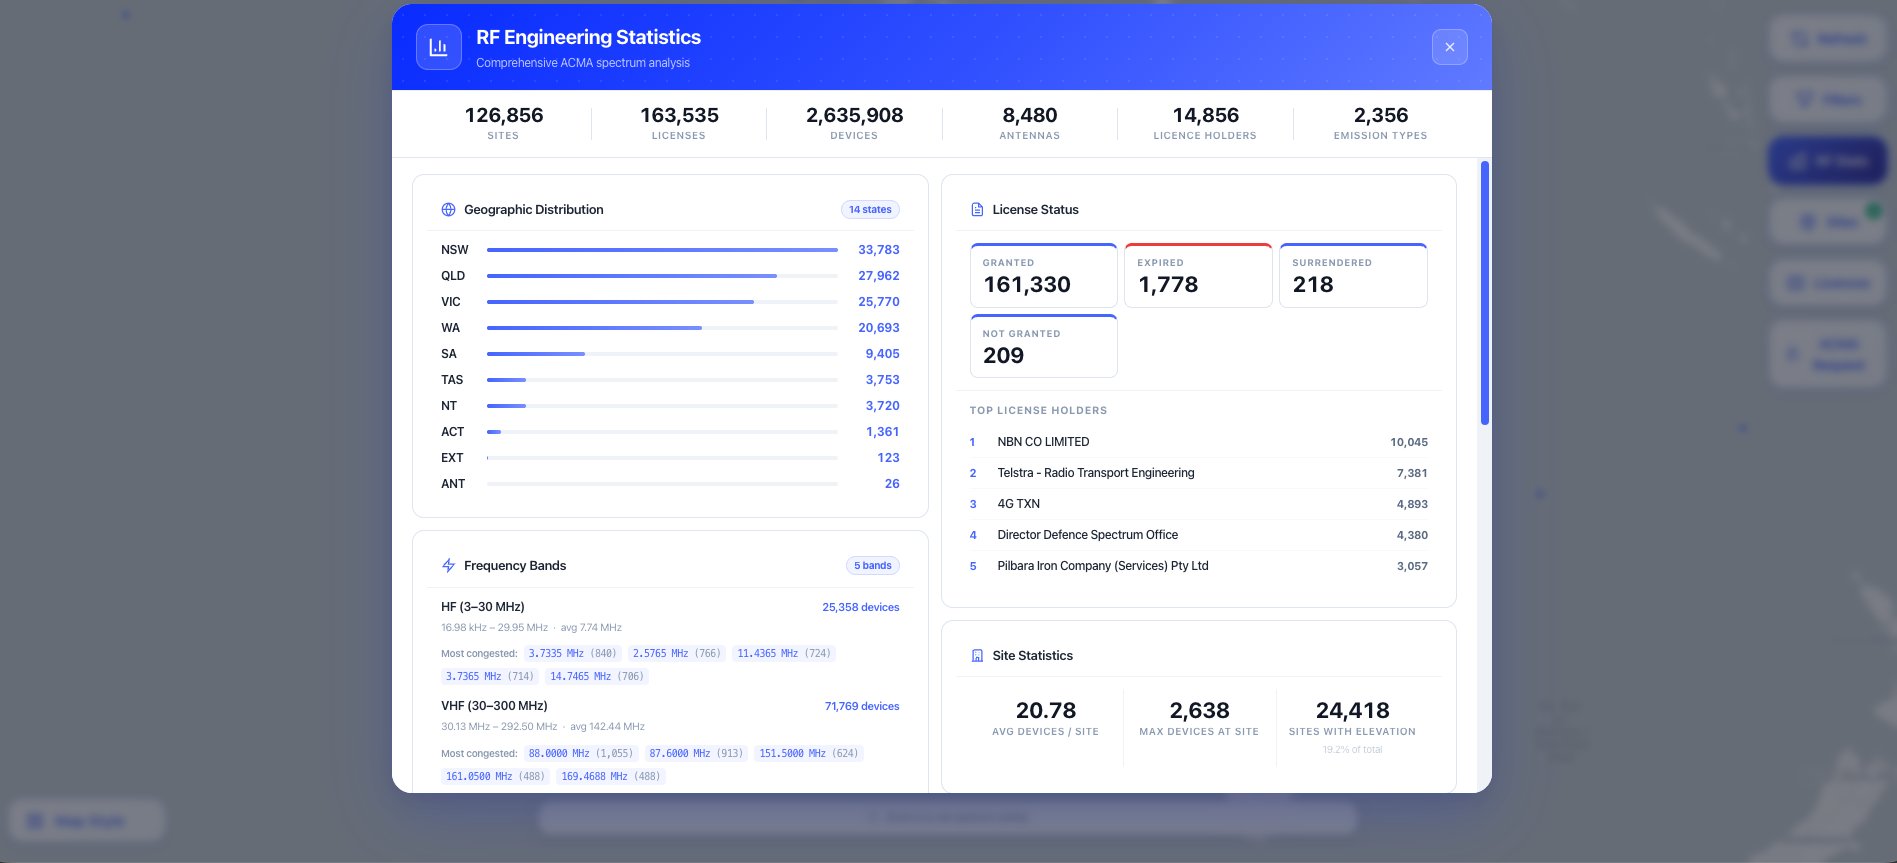
A statistics panel summarises the whole register by state, band, status, licence holder, service and power, and a spectrum strip shows the frequencies in use in the current view. The filtered register exports as CSV, a site's transmitters can be passed to the RF EME Exposure Modeller, and a link can be opened in the Point to Point Link Planner.
Inputs and outputs
What goes in, what comes out
Inputs 7
Map area of interest, by pan and zoom
Search by site name, site ID, licence, postcode or coordinates
Radius search around a point
Filters for location, frequency, bandwidth, emission, power, EIRP, polarisation, status, expiry and licensee
Point to point band filter
Band, duplex split and radius for the channel finder
Sites claimed into a portfolio
Outputs 10
Map of licensed sites from the register snapshot, with its date
Site records covering the overview, frequencies, equipment and antennas
Interference neighbours and RALI LM 08 frequency reuse grades
Point to point link paths, link budgets and neighbour screens
PDF site reports with a CSV of the findings
Channel finder results ranked worst case first
Portfolio dashboard grouped by expiry
Register statistics and a spectrum activity strip
CSV export of the filtered register
Shareable URLs for any view
Standards & methodology
ACMA Register of Radiocommunications Licences, from a dated snapshot
ACMA RALI LM 08 co-channel separation by band (Tables C2 and C3), for land mobile frequency reuse
ACMA RALI FX 3 Appendix 1 protection ratios, for the point to point neighbour screen
ITU-R F.699 reference radiation pattern, for antenna discrimination
ITU-R P.530, P.837, P.838, P.841 and P.676, for point to point clearance, rain, worst month and gas loss
ITU-R P.526 diffraction, for neighbour paths that fail over free space
ITU Radio Regulations Appendix 1 emission designators
Use cases
When to use this tool
01Reviewing every licensed site near a proposed deployment
02Checking the full licence record of a site before planning work there
03Shortlisting co-channel and adjacent channel neighbours for an interference assessment
04Mapping the point to point links in an area or band
05Tracking licence expiry across a portfolio of sites
06Producing a register audit or frequency analysis report for a site
07Finding which sites in an operator's fleet are missing a channel
08Exporting a filtered set of register records to a spreadsheet
From the ACMA Register of Radiocommunications Licences. The map is built on a snapshot of the register refreshed from the ACMA data, and the snapshot date and its age are shown on screen. The official register changes daily, so check it before relying on a channel.
Is the interference screen a coordination?
No. The Interference and Frequency Reuse tabs list registered neighbours, the distance and antenna discrimination between them and, for land mobile, the RALI LM 08 co-channel separation for the band. They take the register at face value and give a shortlist of pairs worth assessing, not a clearance, and the ACMA decides on any licence.
How does the point to point analysis work?
Links are reconstructed from licences that pair two sites, and each opens to both ends and a link budget on the registered values. Assumed inputs, such as the modulation and receiver noise figure, are labelled, and a value the register does not hold is reported as not recorded rather than replaced with a typical figure. Nearby transmitters are screened against the RALI FX 3 protection ratios, first over free space and then with terrain diffraction on the paths that fail.
What do the site reports cover?
The reports cover a register audit, frequency analysis, frequency assignment feasibility, licensing review, co-location and tenancy, and fleet technology. Each is built from the register and issued as a PDF with a CSV of the findings, and each finding states how much of the site it could evaluate. A saved report flags when the register has changed for that site.
Are the reports a compliance certificate?
No, and each report says so. They are built from the register, which records what is licensed rather than what is installed or radiating, so a finding is a matter to check rather than a determination. The reports cannot verify radiated power, EME exposure or the physical installation.
Does the channel finder tell me a frequency is available?
No. It reports what the register holds on each channel and the channels either side within a stated radius, and ranks candidate pairs worst case first. Whether a channel can be licensed depends on the band plan, the service class, embargoes and coordination that the register does not carry, and the ACMA decides.
Can I request a licence from the map?
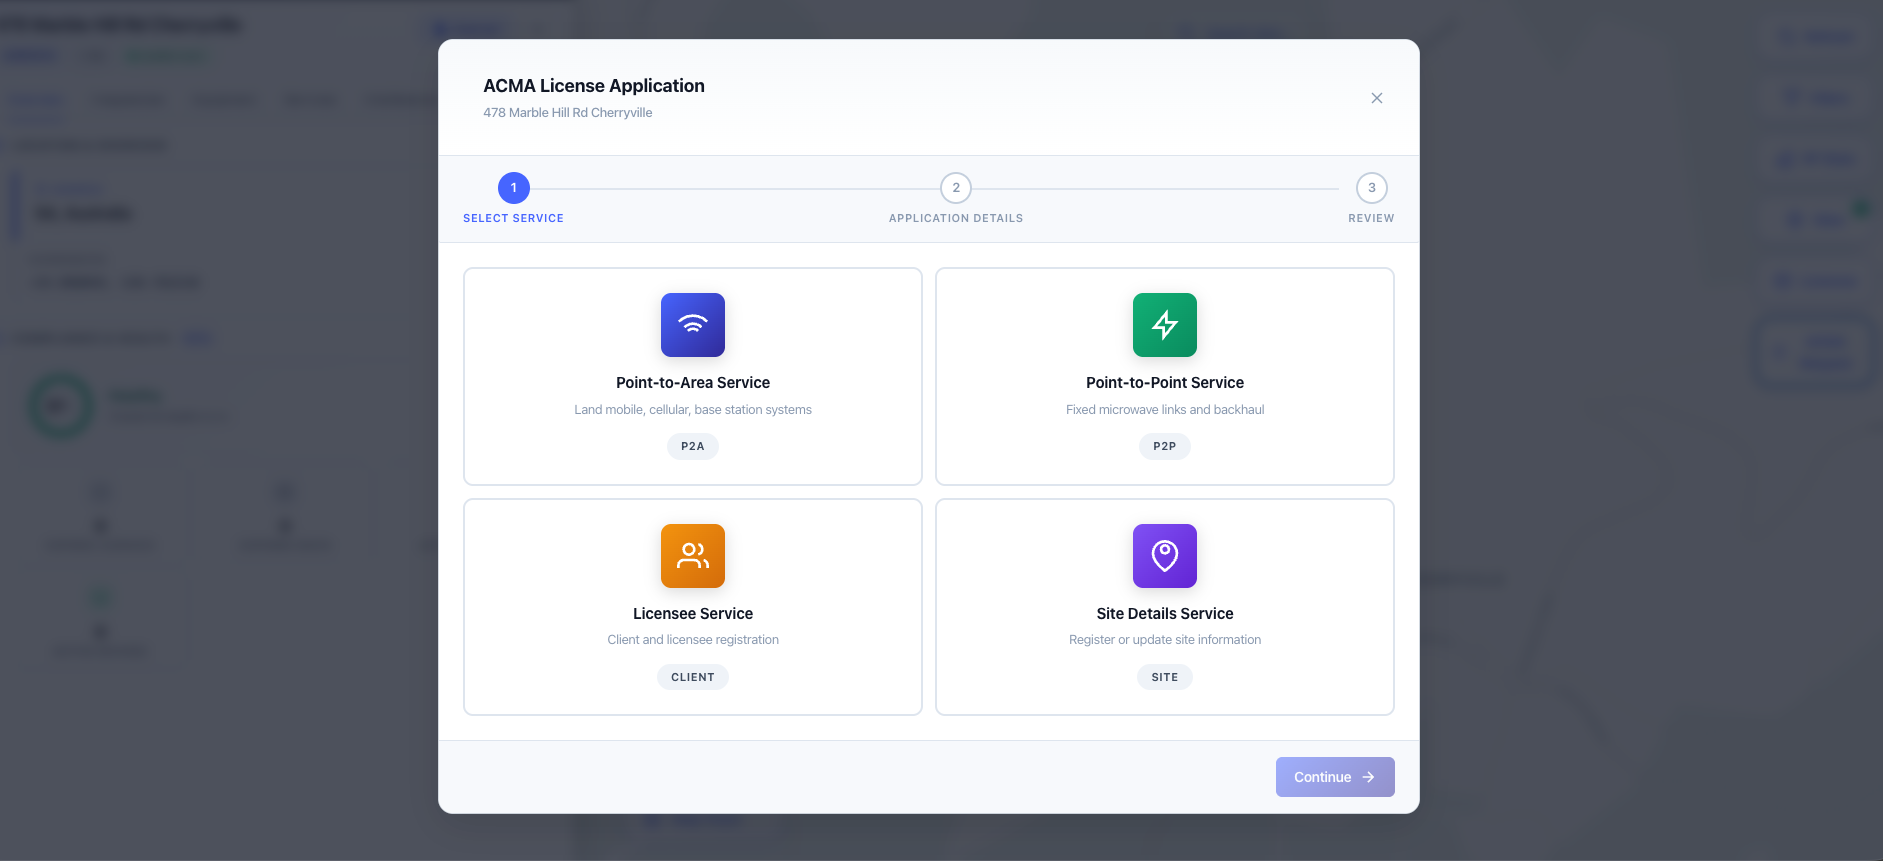
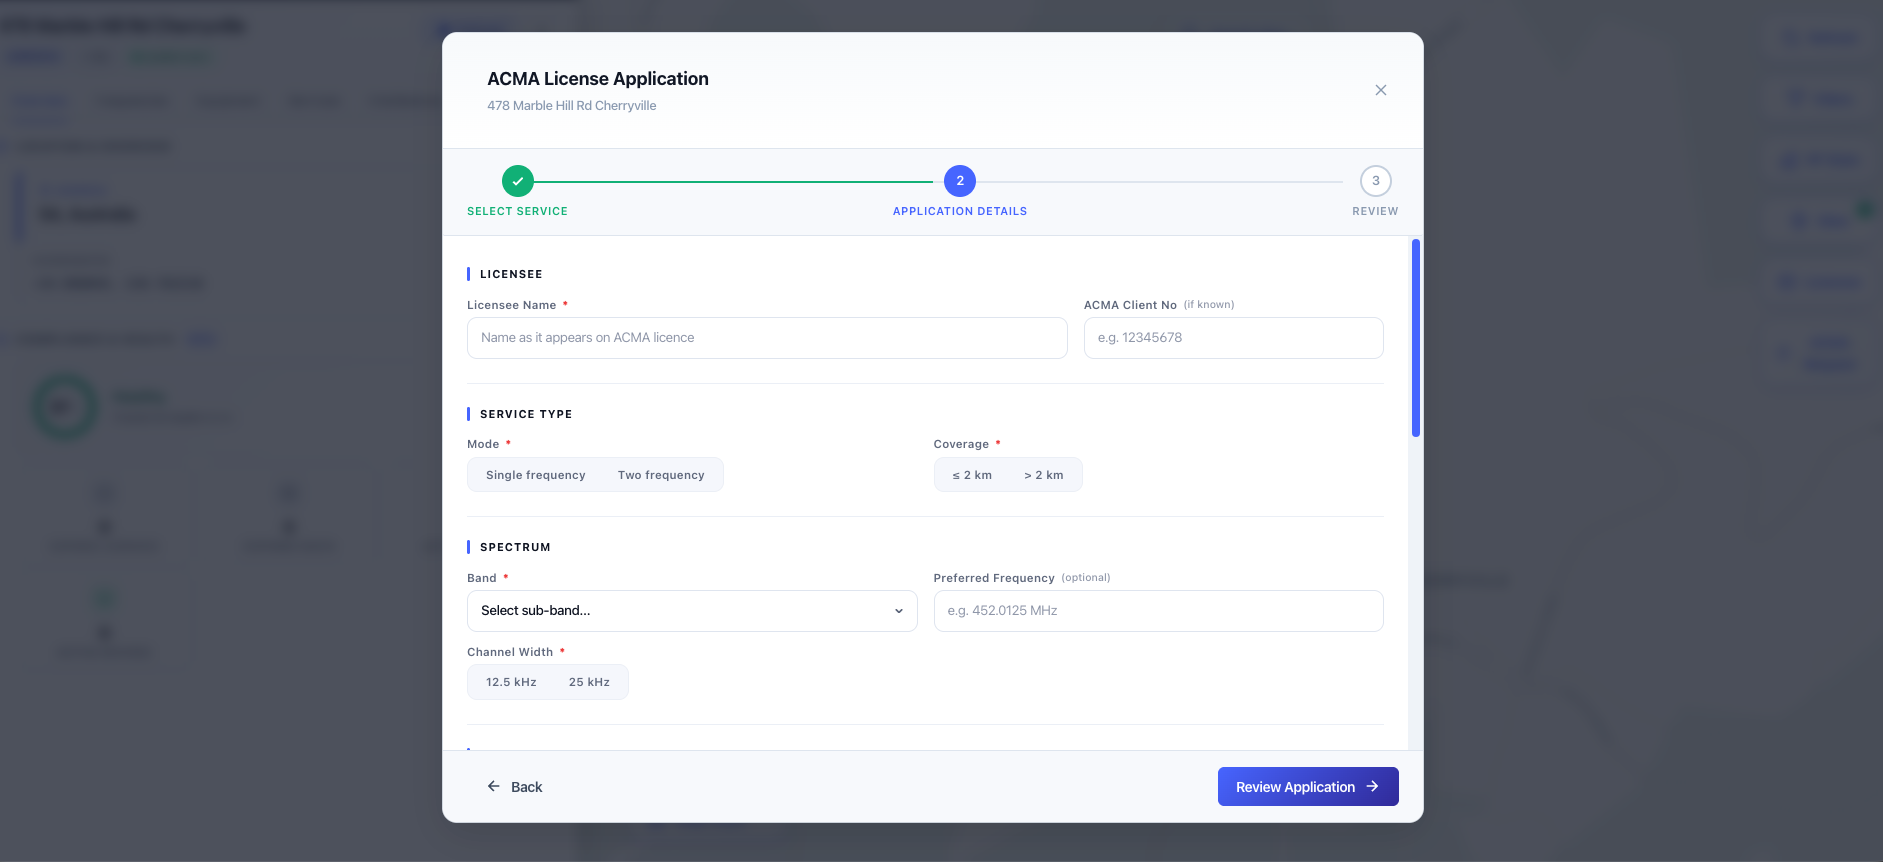
You can send a request for a quote on a point to point or point to area service, or on licensee or site details, from the map. Nothing is lodged or charged from the map itself. If you accept the quote, our director, an ACMA accredited person, coordinates and lodges the application, and the ACMA decides whether a licence is issued.
Does my portfolio stay private?
Yes. Claimed sites and portfolio pages belong to your account and are not visible to other users. The same site can sit in several users' portfolios independently.