System Capacity Design

Erlang C Calculator

Queue based agent and repeater sizing for trunked radio and dispatch systems. Erlang C (M/M/c) with full queue performance metrics, N minus 1 redundancy, and busy hour scenario comparison.

Overview

Trunked radio systems, dispatch consoles, and control room communications behave fundamentally differently from blocking radio networks. When all channels are busy, a new call does not get a fast busy and disappear. It waits in queue until a channel frees up. The right capacity model is therefore not Erlang B but Erlang C, the M/M/c queue model. Sizing a queued system with a blocking model is a common and expensive mistake. It produces channel counts that look right on paper but deliver unacceptable wait times in service, particularly during the morning shift turnover, end of shift, or any incident response.

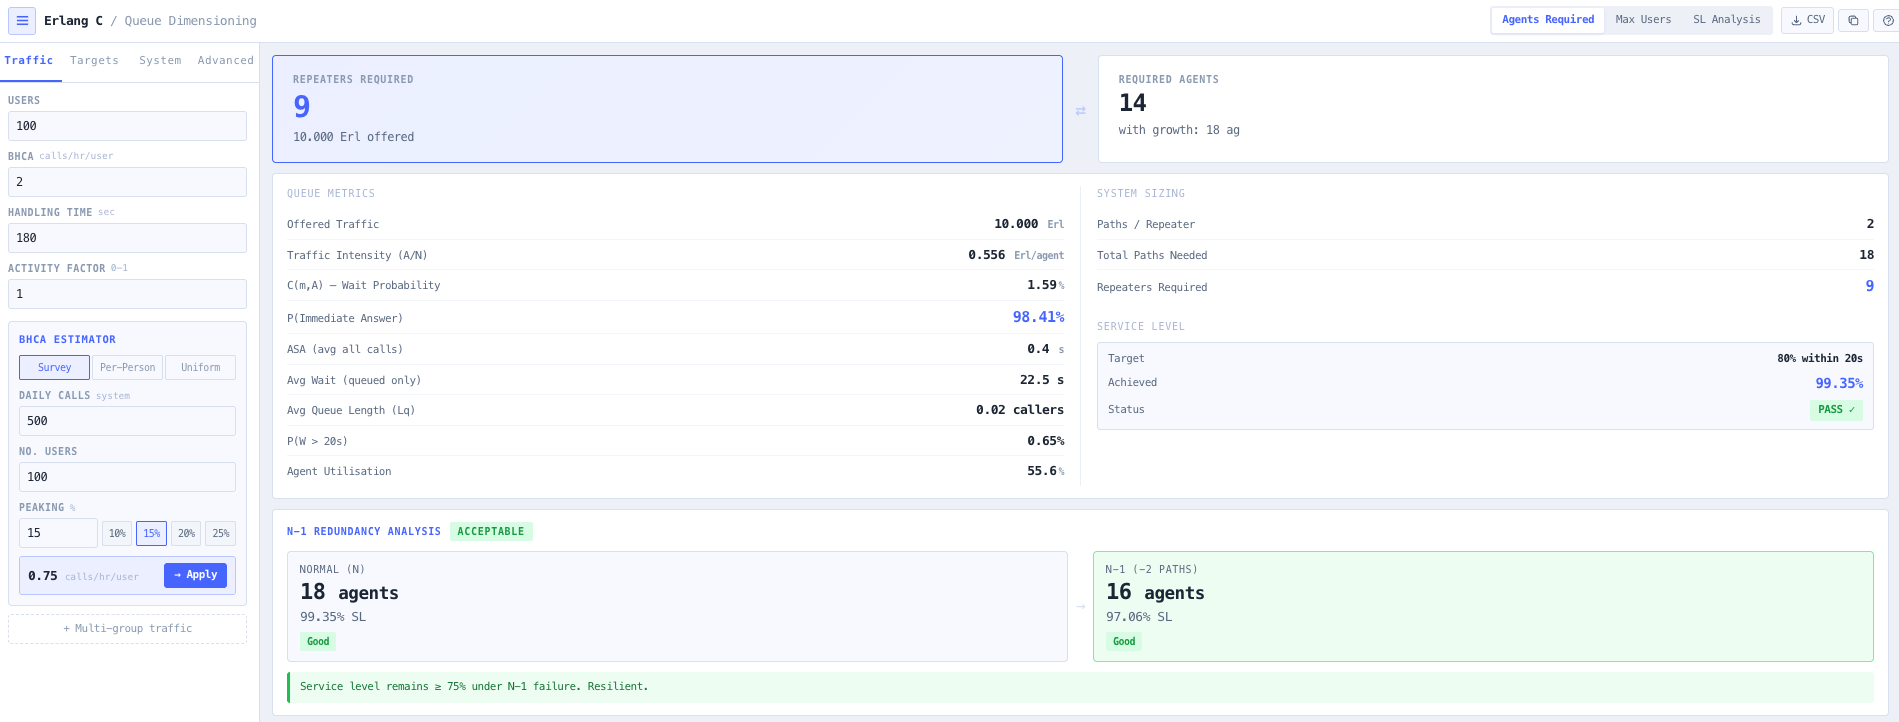
The noIM₃ Erlang C Calculator is a complete capacity planning workspace for queued communication systems. Three calculation modes cover sizing, capacity, and validation. Agents Required finds the minimum agent or channel count to meet a service level target (for example 80 per cent of calls answered within 20 seconds). Max Users finds the largest fleet a fixed channel plan can support at a given service level. SL Analysis evaluates service level and full queue performance for a known agent count and offered traffic. All three drive the same downstream outputs (repeater sizing, N minus 1 analysis, sensitivity sweep, scenario comparison) so switching modes is non destructive.

Queue performance is surfaced comprehensively rather than reduced to a single number. C(m, A) is the probability that an arriving call must queue. P(Immediate Answer) is its complement. Average Speed of Answer (ASA) is the mean wait across all calls including the ones that do not wait. Wq is the average wait for callers who do queue. Lq is the average number of callers waiting. P(W > T) is the probability that wait exceeds a configurable target threshold. Achieved service level is checked live against the target with a clear pass or fail indicator. Together they give the full picture of queue behaviour rather than the misleading impression that a single utilisation number can deliver.

Capabilities

Three calculation modes

Agents Required finds the minimum agent or channel count to meet a service level target. Max Users finds the largest fleet a fixed channel plan can support. SL Analysis evaluates service level and full queue performance for a known channel count and offered traffic. All three modes share the same downstream outputs, so switching modes is non destructive.

Comprehensive queue performance metrics

Every result surfaces the full Erlang C performance profile. Probability a call must queue (C of m and A). Probability of immediate answer. Average speed of answer across all calls. Average wait for queued callers. Average queue length. Probability wait exceeds a target threshold. Achieved service level with a live pass or fail indicator against the configured target.

BHCA estimator and multi group aggregation

Traffic can be entered directly or derived using the built in busy hour call attempts (BHCA) estimator. Three survey methods are supported. System level daily call counts with busy hour peaking. Per person calls per shift. Uniform distribution across shift hours. For mixed fleets such as operations, supervisors, and emergency users with different call patterns, the multi group aggregator accepts separate populations with individual BHCA, average hold time, and activity factor inputs. Weighted average hold time is calculated automatically and used throughout the queue model.

N minus 1 redundancy analysis

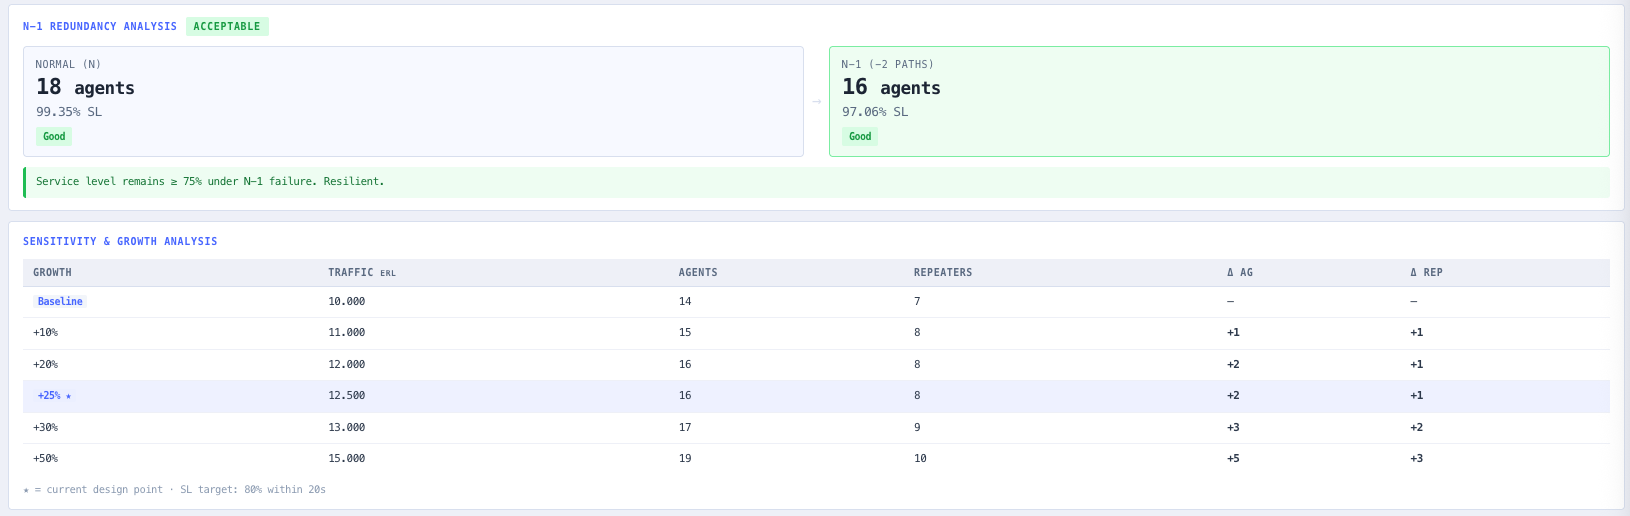
The N minus 1 panel models the impact of losing one repeater from the designed pool, recalculating service level and full queue performance under degraded conditions. Essential for trunked radio in critical infrastructure, public safety, and any environment where a single repeater outage cannot be allowed to push wait times past acceptable thresholds.

Sensitivity sweep

A sensitivity table sweeps offered traffic across a configurable range, showing required agents, repeaters, and service level at each load point. Identifies where queue performance degrades sharply (Erlang C systems often look healthy until utilisation passes 70 to 80 per cent, then collapse rapidly). Useful for validating design margin against projected user growth.

Busy hour scenario comparison

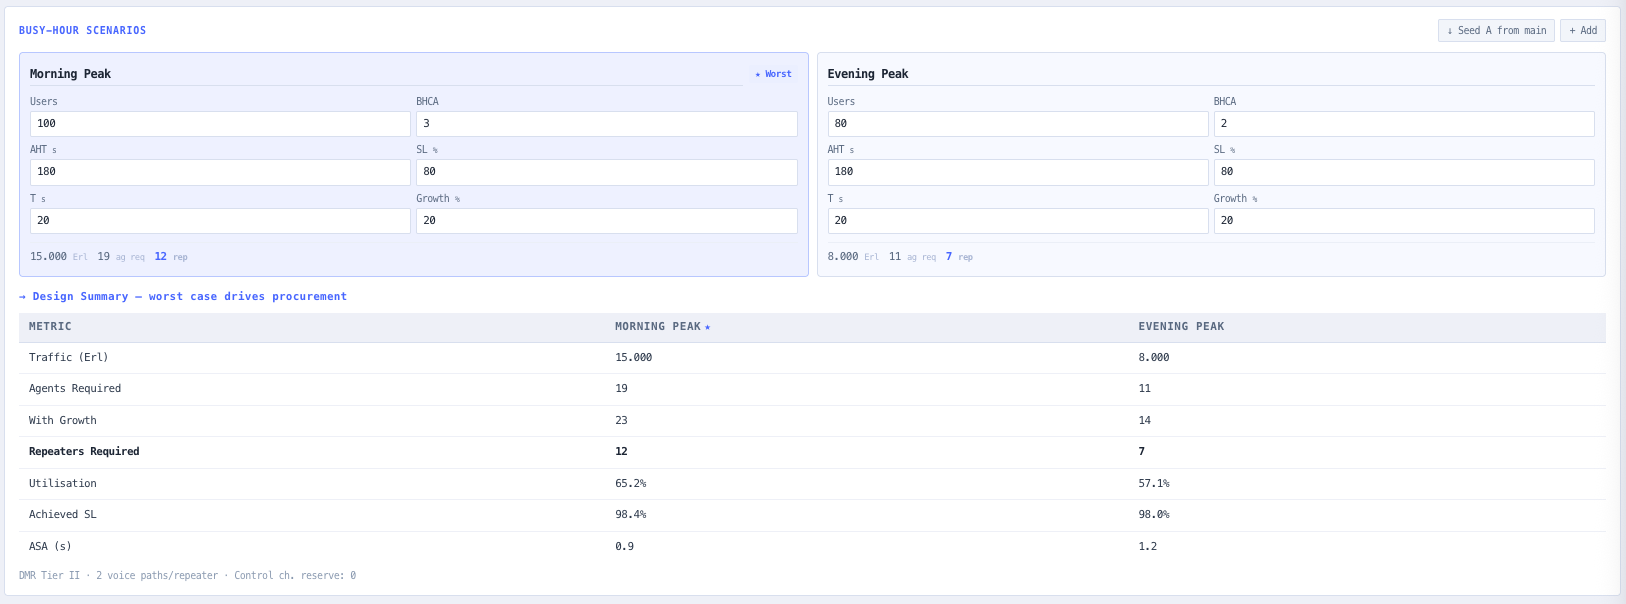
Define up to five named busy hour scenarios with independent user counts, BHCA, average hold time, service level targets, wait time thresholds, and growth margins. The comparison table shows offered traffic, required agents, agents with growth, repeaters, utilisation, achieved service level, and ASA side by side. The worst case scenario is automatically identified and flagged as the procurement driver.

Technology aware sizing

Channel to repeater translation is technology aware. P25 Phase I returns one channel per repeater. P25 Phase II returns two voice channels per repeater. DMR Tier II and Tier III return two voice channels per repeater. TETRA returns four channels per repeater. Analog trunked returns one channel per repeater. Custom multipliers are supported. Output is a deployable repeater count rather than a raw channel number.

Reference Erlang C table and CSV export

A reference Erlang C table is built in for cross checking results against published values. CSV export captures inputs, queue performance, model outputs, sensitivity sweep, and scenario comparison so the analysis can be filed against the project, attached to a procurement document, or submitted with a technical proposal.

Standards & methodology

  • Erlang C M/M/c queue model
  • ITU E.600. Terms and definitions of teletraffic engineering
  • ITU E.501. Estimation of traffic offered in the network
  • ITU E.523. Standard traffic profiles for international traffic streams
  • ACMA spectrum licence application alignment for Australian deployments

When to use this tool

  • Sizing trunked radio systems (DMR Tier III, P25, TETRA) where calls queue
  • Dimensioning dispatch consoles and control room radio infrastructure
  • Validating service level targets such as 80 per cent answered within 20 seconds
  • Evaluating probability of delay and expected wait time under peak load
  • Modelling mixed fleets with different call patterns using multi group aggregation
  • Performing N minus 1 redundancy checks to validate degraded mode performance
  • Comparing morning, evening, and emergency traffic scenarios side by side
  • Supporting procurement justification and technical documentation
  • Sizing emergency services dispatch consoles and call taker positions
  • Producing service level evidence for customer or regulatory submissions
  • Validating a vendor proposed channel and agent count against independent queue modelling
  • Sizing capacity for a contractor radio fleet during a major project ramp up

Is this the right tool for you?

Reach for the Erlang C Calculator in any of the following situations.

  • You are designing a trunked radio system (DMR Tier III, P25 Phase II, TETRA, or analog trunked) where calls queue rather than clear and need a defensible agent and repeater count.
  • You are dimensioning a dispatch console or control room and need to confirm the operator and channel count delivers the required service level.
  • You are responsible for an emergency services or critical communications network and must demonstrate that 80 per cent of calls are answered within 20 seconds at busy hour.
  • You are operating a working trunked radio network and want to verify that current service level holds up under realistic morning shift turnover or end of shift peaks.
  • You are sizing a system that has different traffic peaks at different times (operations, supervisors, emergency users) and need a multi group aggregation rather than treating everyone as the same population.
  • You are evaluating whether your queued system can survive losing one repeater (N minus 1) without breaching service level, and need an explicit degraded mode analysis.
  • You are presenting a procurement case to finance and operations and need a clear capacity argument with wait probability, ASA, and service level rather than a rule of thumb agent count.
  • You are validating a vendor proposed agent and repeater count and want an independent Erlang C cross check before signing the order.
  • You are running a network approaching capacity and need a sensitivity sweep showing where service level collapses as utilisation grows.
  • You are responsible for a control room with a contractually committed answer time and need ongoing evidence that the staffing and channel plan still meets the SLA.
  • You are evaluating different technology choices (P25 Phase II versus DMR Tier III versus TETRA) under the same traffic assumptions and need a like for like agent and repeater count comparison.
  • You are responding to a customer complaint about wait times and need data showing whether the system is genuinely under sized or experiencing an abnormal traffic event.
  • You are training new RF or systems engineers and want a teaching tool that exposes the full Erlang C performance profile rather than reducing queue behaviour to a single number.
  • You are identifying the worst case busy hour scenario for procurement so the agent and repeater count on the order survives every realistic peak rather than only the average day.
  • You need to set a defensible wait time threshold T and verify P(W greater than T) for a customer or regulatory submission.

Frequently asked questions

When should I use Erlang C versus Erlang B?

Erlang C is correct when blocked calls wait in queue for a free channel rather than being cleared. Trunked radio (DMR Tier III, P25 Phase II, TETRA), dispatch consoles, and control rooms are queued environments and need Erlang C. Conventional radio and analog systems where unanswered calls are immediately cleared are blocking environments and need Erlang B. Picking the wrong model produces sizing that looks right on paper but fails in service.

What is service level and how should I set the target?

Service level is typically expressed as the percentage of calls answered within a target wait time, for example 80 per cent answered within 20 seconds (often written 80 / 20). Public safety and emergency services typically require tighter targets such as 90 / 10 or higher. Less critical operations may accept 70 / 30 or 80 / 60. The right target depends on operational expectation, the cost of a delayed call, and any contractual or regulatory commitment.

What does C(m, A) mean and why does it matter?

C(m, A) is the Erlang C probability that an arriving call must wait in queue, given m channels and offered traffic A. It is the foundation metric of the model. Probability of immediate answer is its complement (1 minus C(m, A)). Average speed of answer (ASA) and queue length both derive from C(m, A) combined with average hold time and channel count. Surfacing C(m, A) directly tells you how often the queue actually engages, not just the average wait.

How do I get the busy hour traffic if I do not know my call profile?

The built in BHCA estimator supports three approaches. Enter system level daily call counts with a busy hour peaking factor. Enter per person calls per shift. Or enter uniform distribution across shift hours. For mixed fleets, the multi group aggregator lets you define separate populations with individual BHCA, average hold time, and activity factor inputs, and weighted average hold time is computed automatically.

Does the calculator translate channels to repeater count for my technology?

Yes. Channel to repeater translation is technology aware. P25 Phase I returns one channel per repeater. P25 Phase II returns two voice channels per repeater. DMR Tier II and Tier III return two voice channels per repeater. TETRA returns four channels per repeater. Analog trunked returns one channel per repeater. Custom multipliers are supported.

Why does service level collapse so suddenly as utilisation grows?

This is the defining behaviour of Erlang C systems. Up to about 70 to 80 per cent utilisation, queue length grows slowly. Past that, queue length grows non linearly and service level can collapse over a small change in offered traffic. The sensitivity sweep makes this visible so you can size with margin rather than discovering the collapse during a real busy hour.

Can I model multiple busy hour scenarios at once?

Yes. Up to five named scenarios with independent user counts, BHCA, average hold time, service level targets, wait time thresholds, and growth margins. The comparison automatically identifies the worst case as the procurement driver, so the agent and repeater count on the order survives every realistic peak rather than only the average day.

What does N minus 1 redundancy show?

It recalculates service level and queue performance after losing one repeater from the designed pool. The intent is to confirm that a single repeater outage does not take service level below the contractual or operational threshold. Essential for critical infrastructure, public safety dispatch, and any environment where a single failure cannot be allowed to take the network down.