Antenna Utilities

RF EME Exposure Modeller

Interactive 3D RF EME (electromagnetic energy) exposure and RadHaz modelling environment. Draw a tower, mast or rooftop by hand (custom section profiles, drag-placed antennas, site buildings), import the licensed device set straight from the ACMA register or load measured antenna patterns, and model ARPANSA RPS S-1 / IEC 62232 exclusion zones with the field rendered as nested 3D shells in the site-guide colours, correct multi-transmitter summation, whole-body spatial averaging, climb permit-to-work planning, named receptors, co-location apportionment by operator, an IEC 62232 uncertainty budget, and exportable compliance reports, antenna mounting schedules and fence setting-out sheets.

Included in the 14-day Pro trial on every new account. No credit card.

Overview

RF electromagnetic energy (EME) compliance sits awkwardly between a hand calculation and a full measurement survey. A single-transmitter spreadsheet using S = EIRP / 4πr² gets you a boresight compliance distance in seconds, but real sites carry many transmitters from several carriers and services, and the regulation requires you to sum their contributions. A full on-site measurement survey gives the definitive answer but cannot be run during planning, before equipment is installed, or every time a carrier adds a panel. The result is that exclusion zones are often scoped with conservative single-source rules of thumb that either over-restrict access or miss the combined field where main beams overlap.

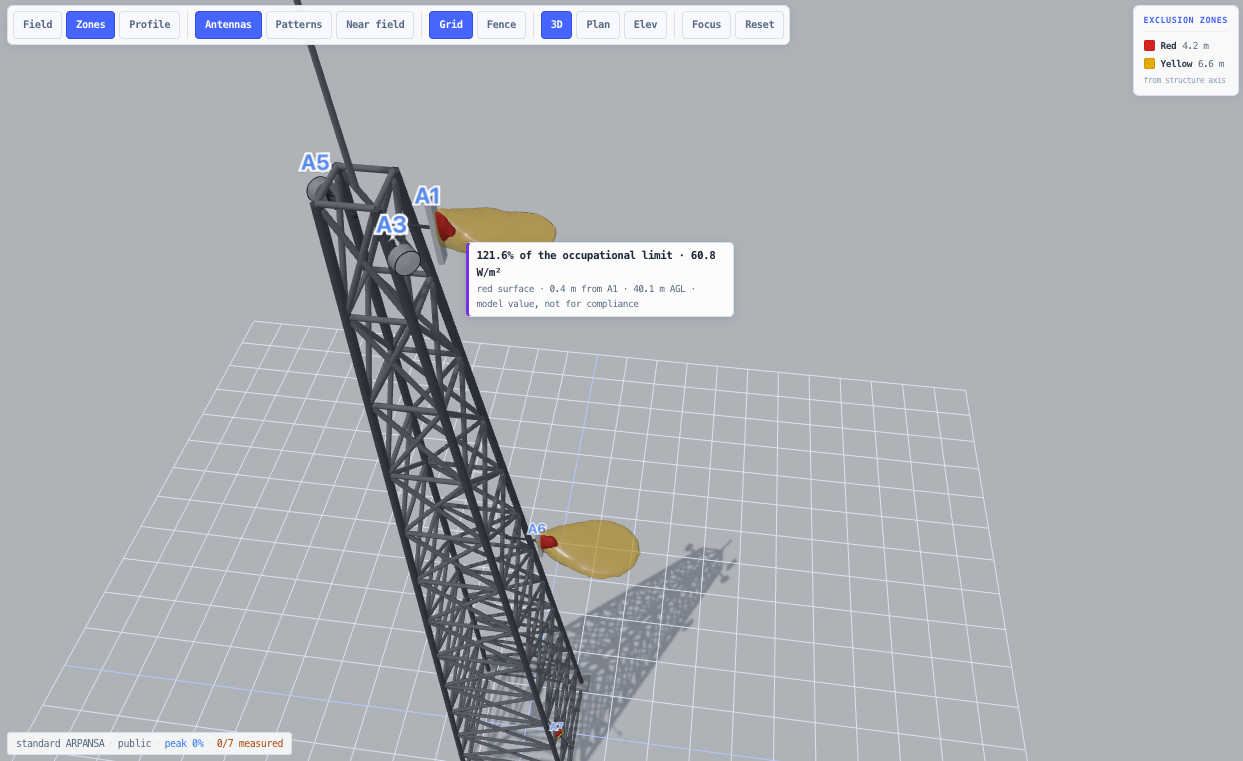
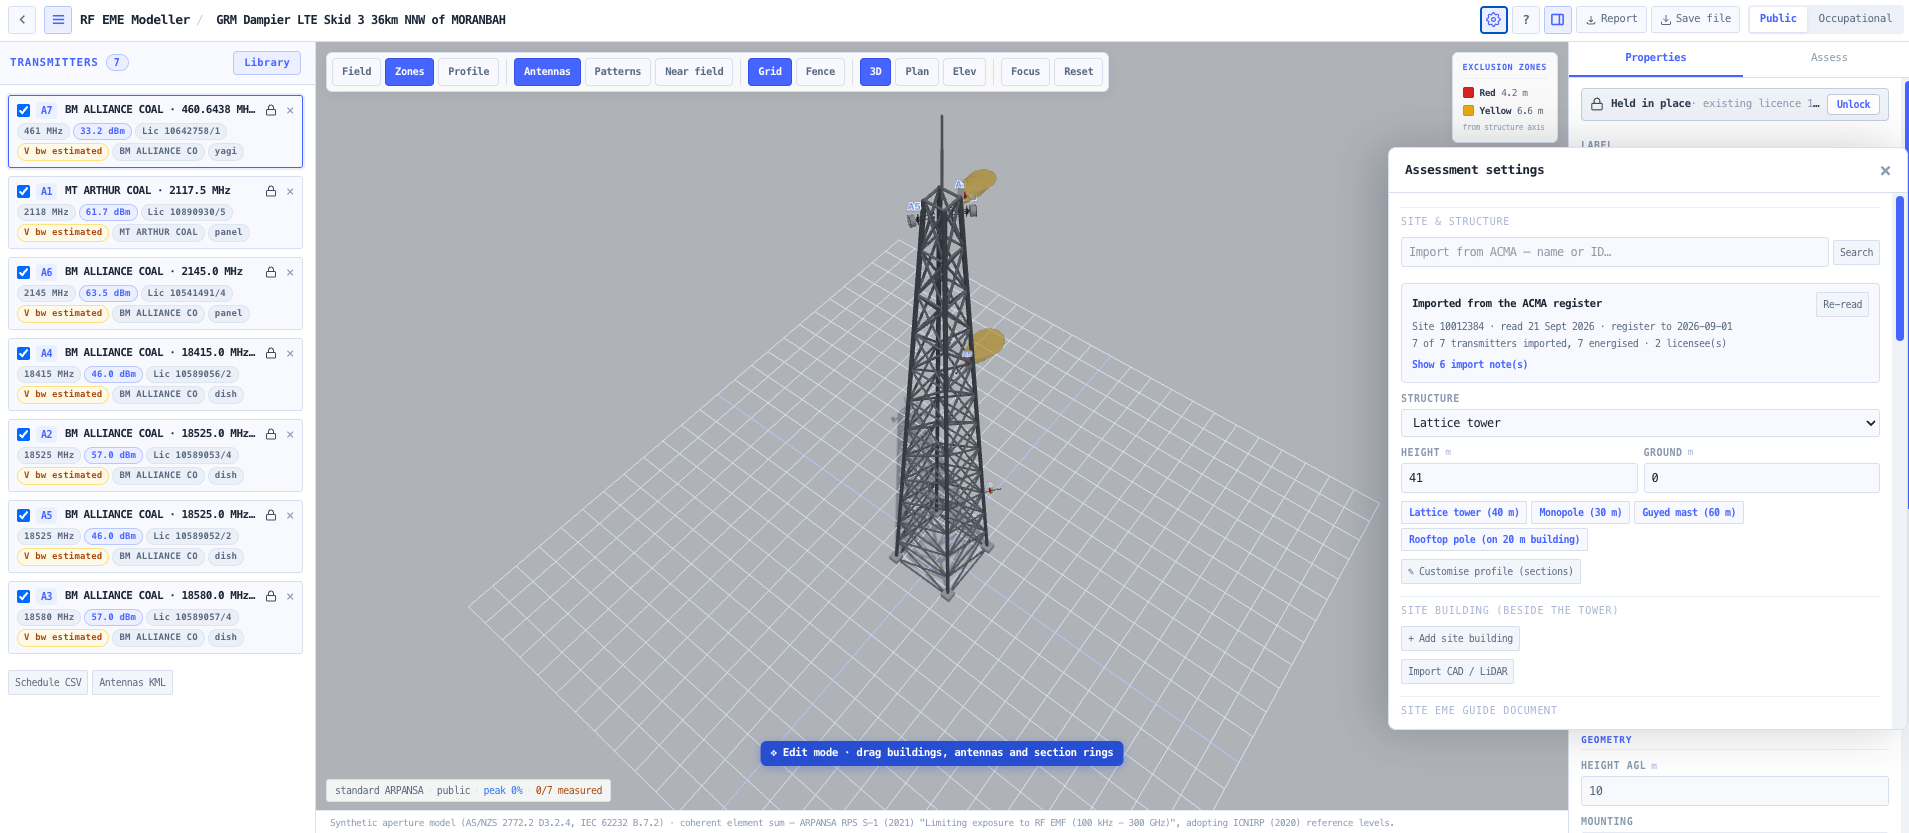
The noIM₃ RF EME Exposure Modeller occupies that gap as an IEC 62232-aligned desktop assessment environment. You build a 3D model of the supporting structure (lattice tower, monopole, guyed mast or rooftop pole), place the transmitters on it, and the tool computes the summed power-density field around the structure. The default method is the synthetic aperture technique of AS/NZS 2772.2 App. D3.2.4 and IEC 62232 B.7.2, which models each antenna as the dipole stack or tapered aperture it is and sums its elements coherently, so a panel draws its real elevation lobe, sidelobes and nulls instead of a flat-sided slab; every synthesised antenna is then checked against its datasheet on the AS/NZS 2772.2 Table D3 desk tests, with the result printed per antenna and the field-model term of the uncertainty budget following Table D4. The FCC OET-65 cylindrical wave and plain free-space inverse square remain selectable as more conservative screens, alongside optional ground reflection, image-method wall reflections and ITU-R P.526 terrain diffraction on probes. The field view draws the exposure as nested closed surfaces around every antenna in the colours a site guide uses: red where the occupational limit is exceeded, yellow where the public limit is exceeded, then lime at 50% and green at 10% of the public limit, so the full spatial picture is read from any angle without choosing a plane or a bearing, and hovering any surface reads out the engine's own value at that point.

Two workflows make it a working instrument rather than a calculator. The first is the ACMA import: because the licensed EIRP, antenna height, azimuth and polarisation for every device already live in the ACMA radiocommunications register that powers the rest of the noIM₃ platform, you can search a site and pull its entire transmitter set in one click, then answer the everyday question directly, such as "there is already a carrier panel here and I am adding a 10 W DMR dipole, what is the total exclusion zone?". The second is measured-pattern import: load an OEM .msi / Planet pattern and the assessment moves from a generic-envelope screening to a measured-pattern basis, which is reflected in the IEC 62232 uncertainty budget. Exposure is summed across all energised transmitters as Σ(Sᵢ / S_limitᵢ), assessed at the time-averaged maximum power per IEC TR 62669, and every result carries a 95% confidence interval. Named receptors, a worker climb permit-to-work with a per-source shutdown plan, a reproducibility audit digest, and an ARPANSA-aligned compliance report turn the model into a defensible, repeatable deliverable. The site itself is drawn by hand (custom tower section profiles, drag-placed antennas with face snapping, buildings beside or beneath the mast), and the outputs go beyond the report: an antenna mounting schedule for riggers, a fence setting-out sheet with signage quantities for the contractor, and co-location apportionment by operator with the limit headroom available to a prospective tenant.

Capabilities

Interactive 3D WebGL site model

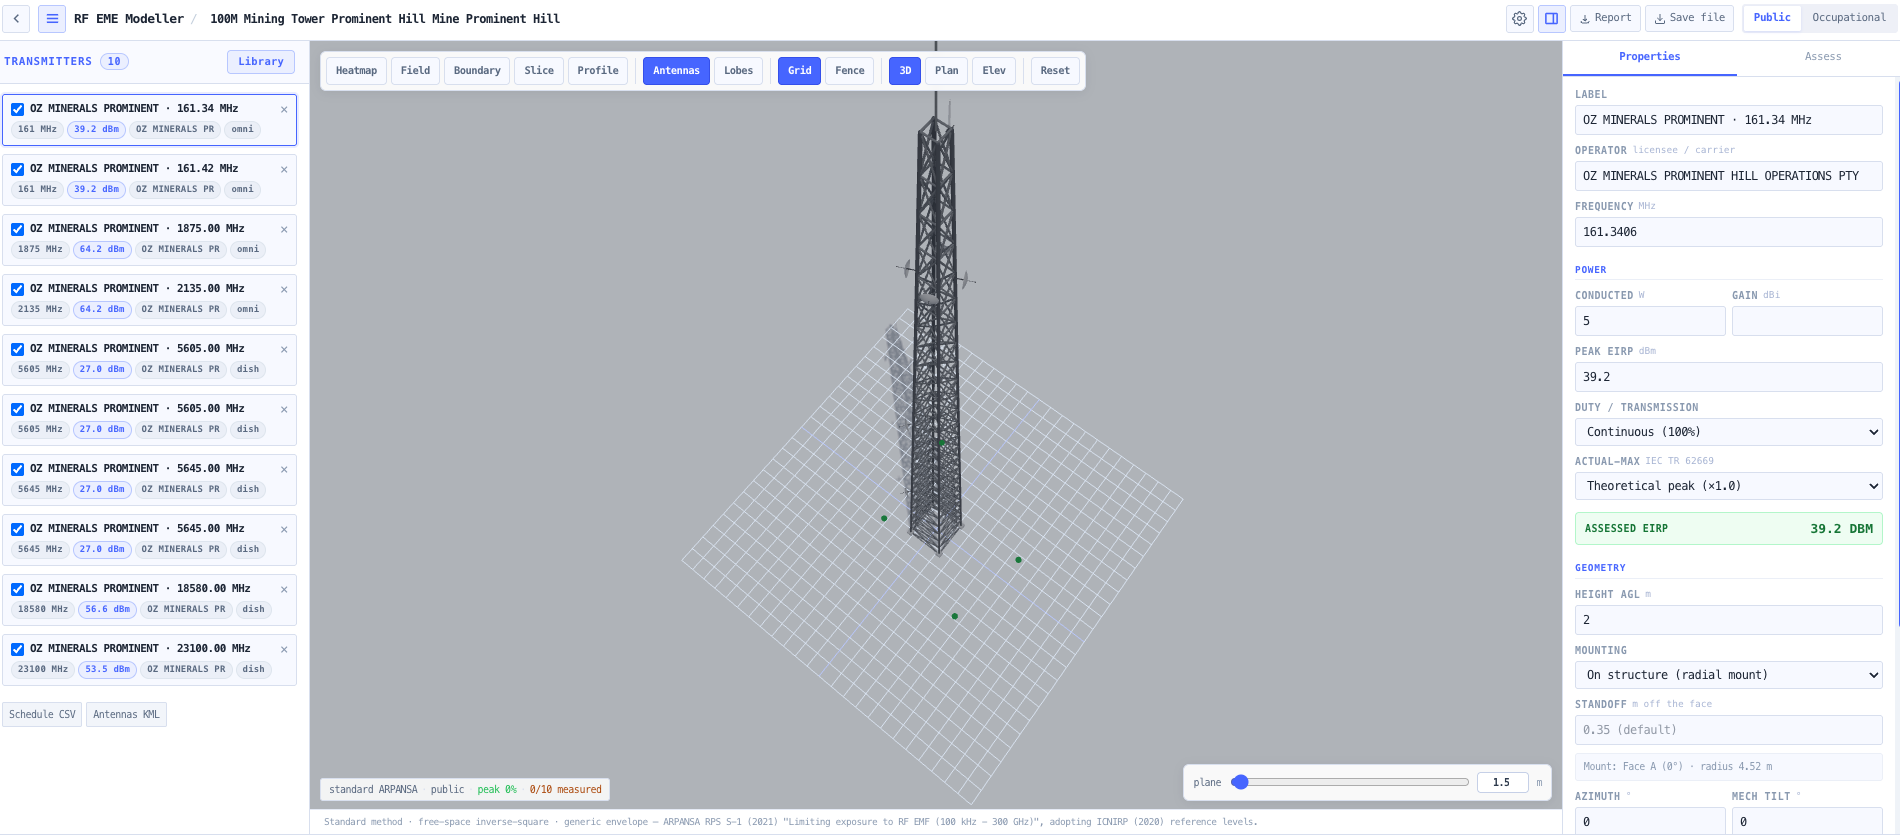
Three.js powered viewport with orbit, pan and zoom. Model a lattice tower, monopole, guyed mast or rooftop pole with configurable height, place transmitters at their mounting heights and azimuths with pointer-based placement, and see the antenna boresights and main-beam lobes drawn in 3D. The field shells, the red and yellow exclusion-zone surfaces and each antenna's 3D radiation pattern overlay directly on the scene, all drawn the same way, so the spatial extent of the hazard is visible rather than abstract.

ACMA licence import

Open a site straight from the ACMA register map, or search the register from the modeller by site name or ID, and import its licensed transmitter set: EIRP, frequency, bandwidth, antenna height, azimuth, tilt, polarisation, licensee and the registered antenna model with its gain, horizontal beamwidth and front-to-back ratio, granted licences only unless you say otherwise. Registered models held in the component catalogue carry their measured patterns across; the register holds no vertical beamwidth, so elsewhere it is estimated from gain and beamwidth and clearly labelled. The single best starting point for a real Australian site assessment.

Measured antenna-pattern import

Load measured or OEM patterns from .msi / Planet horizontal-and-vertical files or CSV, and the engine uses the real pattern in preference to the generic 3GPP TR 38.901 envelope. The assessment basis is shown explicitly as Screening (generic), Mixed, or a definitive Measured-pattern assessment, and importing measured patterns reduces the dominant term in the IEC 62232 uncertainty budget.

Multi-transmitter summation and IEC TR 62669 power model

Real sites carry many transmitters from several carriers and services. Exposure is summed correctly as Σ(Sᵢ / S_limitᵢ) across all energised transmitters, per the ICNIRP/ARPANSA simultaneous-exposure requirement. Each source is assessed at its time-averaged maximum EIRP (peak EIRP × transmission/duty factor × actual-maximum statistical factor per IEC TR 62669), so 5G beamforming and TDD duty are handled rather than assumed continuous.

ARPANSA / ICNIRP / FCC / IEEE reference levels

Select the standard: ARPANSA RPS S-1 (which adopts the ICNIRP 2020 reference levels), ICNIRP 2020, FCC OET-65 / 47 CFR §1.1310, or IEEE C95.1-2019. Switch between general-public and occupational/controlled populations with standard-correct time averaging. The frequency-dependent reference levels are taken from the validated, unit-tested noIM₃ exposure tables, with the standard citation carried through to the report.

Synthetic aperture model, checked against the datasheet

The default field model is the synthetic aperture technique of AS/NZS 2772.2:2016 Appendix D3.2.4 and IEC 62232:2022 B.7.2: each antenna is modelled as the stack of dipoles or the tapered aperture it actually is, calibrated to its declared beamwidths, aperture or measured cut, and the field is the coherent sum of its elements in every direction. A panel therefore projects its real elevation lobe, sidelobes and nulls rather than a flat-sided slab. Every synthesised antenna is then run against the AS/NZS 2772.2 Table D3 desk checks (gain, vertical and horizontal half beam-widths), the pass or fail is printed per antenna in the report, and the field-model term of the uncertainty budget follows Table D4 instead of a fixed figure. The OET-65 cylindrical wave and free-space inverse square stay available as more conservative screens.

Hover any surface for the engine value

Every drawn surface is checkable. Hover a zone or a field shell and a chip reads the percentage of the limit that surface is drawn from with the summed power density in W/m², the distance from the nearest antenna and the height; hover a radiation pattern and it reads the modelled gain in dB below peak and in dBi with the azimuth and elevation off boresight and which pattern it came from. It reports the model rather than the assessment, so where RPS S-1 does not accept incident power density the figure is still shown and marked as a model value, not for compliance.

Carriers held on one physical antenna

The ACMA register holds one device record per carrier and none for the antenna, so a two-carrier base or a multi-band panel arrives as several records at the same height and bearing. Records that share licence, model, polarisation and mounting are held as one antenna: one glyph on the structure, one reference, one row on the equipment table and the mounting schedule with its carriers and their total power listed. Dragging it moves every carrier and the pattern, gain and mount are held identical across them, while the engine still sums each carrier as its own source. Register imports arrive held in place so the licensed geometry cannot be nudged by accident, with a per-antenna padlock to release one.

Whole-body spatial averaging and compliance volumes

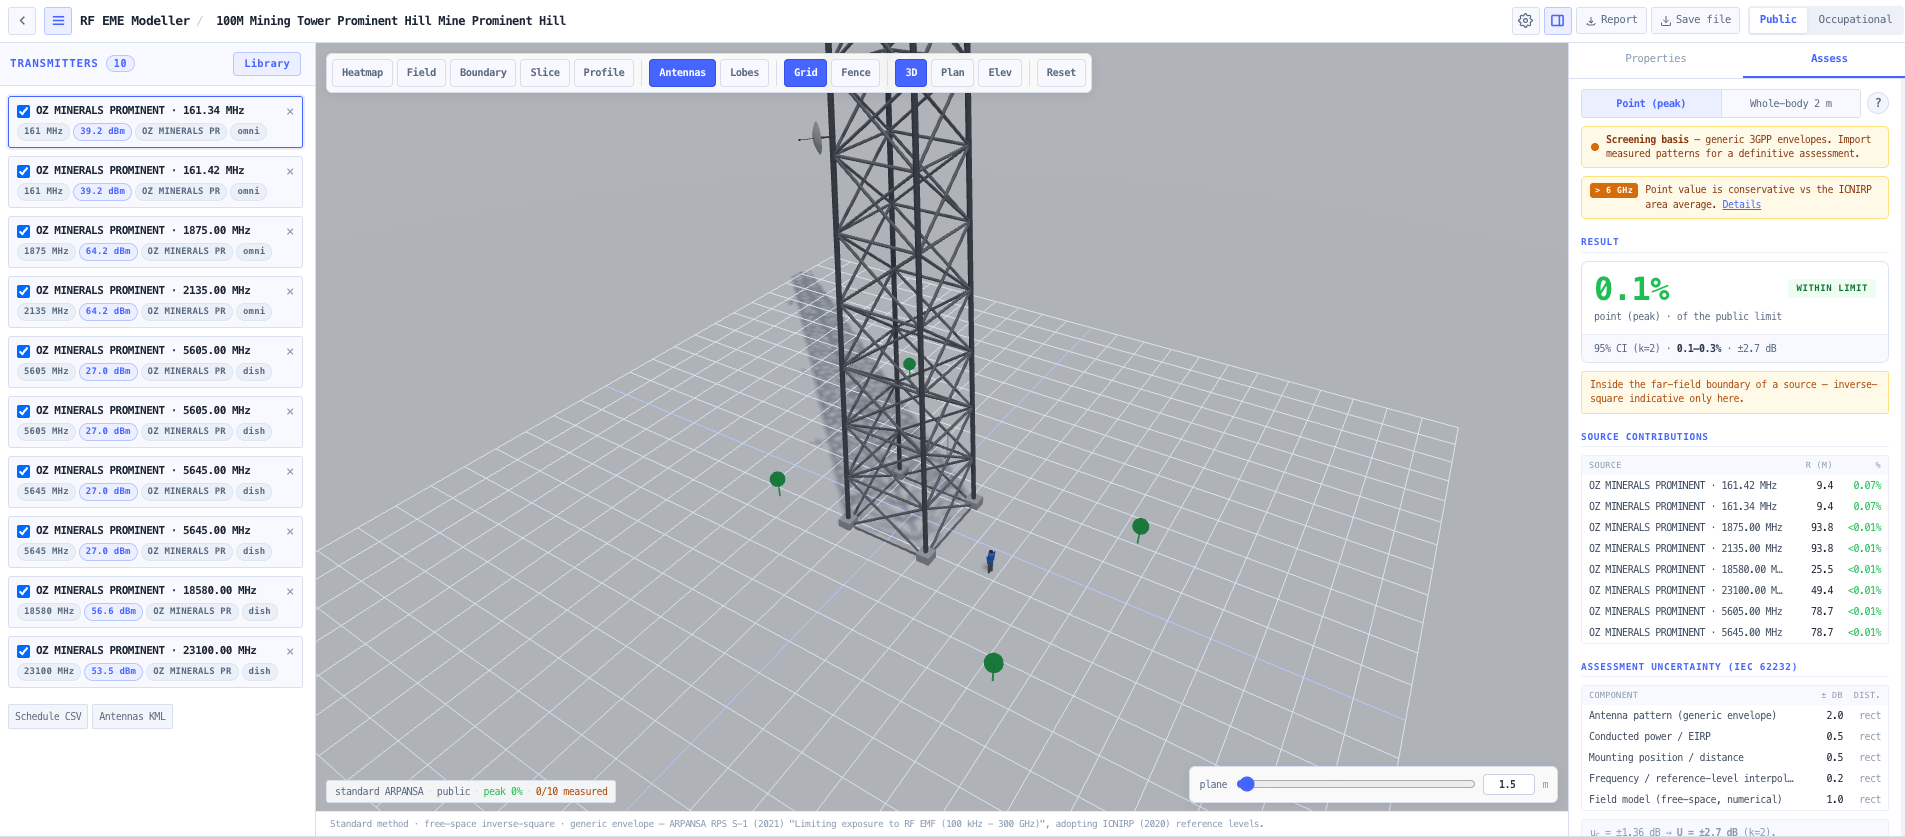
Assess a point as the spatial peak, or as the IEC 62232 whole-body spatial average over a 2 m vertical line at the receptor (the compliance basis), with the point peak shown as the conservative upper bound. The 100% exclusion boundary is rendered as 3D iso-surfaces for both public and occupational populations, inside the colour-coded 3D field, with an exposure-vs-distance profile along any bearing.

Worker climb permit-to-work

Assess a vertical climb up the structure across every face. The engine sweeps bearings around the mast (including each sector azimuth) and reports the worst face, the peak percentage and the height it occurs at. Where the climb exceeds the limit, a route-wide shutdown solver returns the minimal set of sources to de-energise or reduce (in dB) to make the whole climb safe, forcing full isolation where the route passes a live aperture in the near field.

Named receptors and point probes

Define repeatable assessment locations (nearest residence, footpath, balcony, plant deck) as named receptors with a live results table (Σ %, zone, pass/fail) and colour-coded 3D pins, all flowing into the report. Right-click anywhere to drop an ad-hoc probe for the percentage of the limit, the per-source breakdown, the dominant contributor, a near-field flag and the maximum safe occupational dwell time.

IEC 62232 uncertainty budget

Every result carries a 95% confidence interval. A transparent Type-B uncertainty budget (antenna pattern, EIRP, position, reference-level interpolation, field model) is combined in quadrature per the GUM and expanded by k = 2. The dominant antenna-pattern term shrinks when measured patterns are used, so the budget reflects the actual basis of the assessment rather than a fixed figure.

Propagation refinements, honestly labelled

The conservative free-space inverse-square base can be augmented with a worst-case two-ray ground-reflection allowance, first-order image-method wall reflections, ITU-R P.526 terrain diffraction shielding on probes (real DEM), and a cylindrical near-field continuation inside the far-field boundary. Where a model is not included (full multipath/ray-tracing, urban clutter, the >6 GHz area-averaged metric, induced/contact currents below 110 MHz), that is stated explicitly and the conservatism direction is given.

Reproducibility audit digest

Every assessment carries a tamper-evident SHA-256 audit ID derived from only the result-determining inputs plus the engine method version. The same physical assessment always produces the same ID, and any change that could move a number changes it, so a report can be regenerated and defended (or a discrepancy detected) from the ID alone.

Draw the site by hand

The viewport is an editor, not just a display. Sculpt a custom tower as stacked lattice and pole sections, drag the section boundaries on the model to resize them, add work platforms and guy levels, then hang antennas by dragging them up the tower and around it (snapping onto named faces), or place them free-standing anywhere on the site, including on the roof of a site building beside the tower. Buildings drag into position; a rooftop host building slides under its mast. Everything edited by hand lands in the schedules, drawings and report.

Deliverables a rigger and a fencing contractor can act on

The antenna mounting schedule states each antenna's face or leg, height, azimuth and tilts with the assessed EIRP, as a PDF table, a CSV, and KML placemarks over the real site. The site fence / barrier check gives an adequacy verdict against the public limit with a corner setting-out schedule (east/north and lat/lon), total fence length, CSV/KML export and an indicative signage count. Headline ground-level exclusion distances come from the true Σ = 100% contour of the combined field, so offset antennas and multiple hotspots are bounded correctly.

Co-location apportionment by operator

Shared-site compliance is cumulative, but responsibility is per licensee. Transmitters carry their operator (auto-filled from the ACMA licensee on import), and the assessment apportions the cumulative exposure at the worst publicly-accessible point between operators (equal limit-shares by default, or the site's custom sharing arrangement), with a per-operator within-share verdict and the limit headroom available to a prospective co-locator. Shares are clearly labelled as contractual site policy; the regulatory verdict remains the total at or below 100%.

Drawings generated from the assessed field

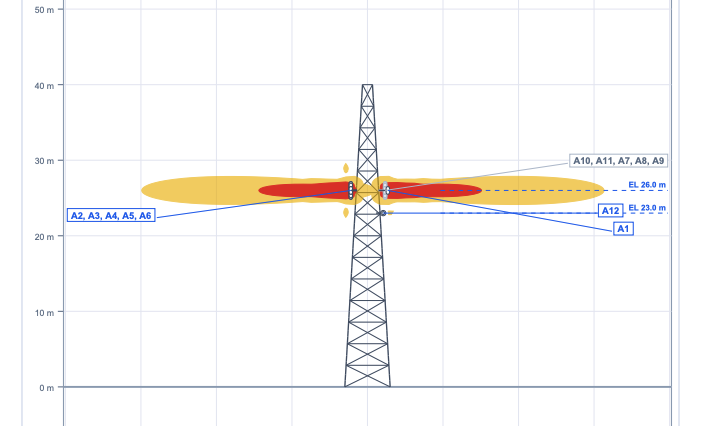
The guide carries a 3D view of the zones with a close-up at each antenna cluster, the elevation from each side the zones ask for (a lobe pointing at the reader on one sheet runs across the next), and every antenna level cut both ways, in plan and from the side. Each is at a true paper scale on A4 with metre rulers on both axes, the red and yellow legend, a north arrow or viewing-side indicator, level lines and the same antenna references used throughout the report, with each antenna drawn as what it is and tied to the structure by its mount arm. A figure that would repeat its neighbour on a small site is left out.

ARPANSA-aligned compliance report

Generate a PDF carrying an ARPANSA-aligned Environmental EME Report (maximum cumulative EME level as a percentage of the public limit at standard distances, 1.5 m AGL), scaled plan and elevation exclusion-zone drawings, the transmitter inventory with assessed EIRP, the access-zone signage schedule, the named-receptor table, the worker climb permit, the uncertainty budget, the audit ID and an explicit methodology and limitations statement. Scenes also export to a portable .noim3-eme.json file and autosave to the browser.

Standards & methodology

  • ARPANSA RPS S-1 (2021): Limiting exposure to RF EMF (100 kHz to 300 GHz), adopting ICNIRP 2020 reference levels
  • ICNIRP (2020) Guidelines for limiting exposure to electromagnetic fields (100 kHz to 300 GHz)
  • FCC OET-65 / 47 CFR §1.1310 maximum permissible exposure (MPE) limits
  • IEEE C95.1-2019 RF safety standard
  • IEC 62232: Determination of RF field strength, power density and SAR near base stations; whole-body spatial averaging and uncertainty
  • IEC TR 62669: Case studies supporting product compliance (actual-maximum + duty power model)
  • ITU-R P.526: Propagation by diffraction (terrain shielding); 3GPP TR 38.901 generic element radiation pattern

When to use this tool

  • Scoping an RF EME exclusion zone for a multi-carrier tower or rooftop before access
  • Answering the combined-exposure question when adding a transmitter to an existing site
  • Planning a tower climb with a defensible worst-face assessment and a per-source shutdown permit
  • Worker safety assessment for tower climbers and rooftop maintenance crews
  • ARPANSA RPS S-1 / IEC 62232 desktop compliance assessment for a fixed installation
  • Producing an ARPANSA-aligned Environmental EME Report for a site
  • Public exposure assessment at named receptors (nearest residence, footpath) near a broadcast or cellular site
  • Moving from a generic-envelope screening to a definitive measured-pattern assessment
  • Rapid what-if on a power increase, retune or added carrier at a licensed site
  • Apportioning a shared site between licensees and quoting limit headroom to a prospective co-locator
  • Designing the public exclusion fence with a setting-out schedule and signage quantities for the contractor
  • Producing the antenna mounting schedule for riggers from the as-modelled layout
  • Producing EME documentation with a reproducible audit ID for an ACMA submission
  • Pre-measurement scoping to focus an on-site survey where the field is highest, then calibrating the model against the survey
  • Sanity checking a vendor or carrier EME report against the underlying physics

Frequently asked questions

What assessment method does the tool use?

The default is the synthetic aperture technique of AS/NZS 2772.2 App. D3.2.4 and IEC 62232 B.7.2: each antenna is modelled as its dipole stack or tapered aperture, calibrated to the declared beamwidths, aperture or measured cut, and the field is the coherent sum of its elements, with the far-field pattern taken from an imported measured file where one is loaded and the generic 3GPP TR 38.901 envelope otherwise. Contributions are summed across transmitters as Σ(Sᵢ / S_limitᵢ) and assessed at the time-averaged maximum power (IEC TR 62669). The FCC OET-65 cylindrical wave and plain free-space inverse square S = EIRP · g(θ,φ) / 4πr² are selectable as more conservative screens, and a worst-case two-ray ground-reflection allowance, first-order image-method wall reflections and ITU-R P.526 terrain diffraction on probes can be added. It does not model full multipath/ray-tracing, urban clutter, the >6 GHz area-averaged metric or induced/contact currents below 110 MHz. Where a model is not included that is stated, the conservatism direction is given, and near-field points are flagged.

Which exposure standards are supported?

ARPANSA RPS S-1 (2021), which adopts the ICNIRP 2020 reference levels; ICNIRP 2020 directly; FCC OET-65 / 47 CFR §1.1310; and IEEE C95.1-2019. You can switch between the general-public and occupational/controlled populations with standard-correct time averaging. The reference levels come from the validated, unit-tested noIM₃ exposure tables shared with the Antenna Power Density calculator.

What is the difference between a screening and a measured-pattern assessment?

A screening assessment uses a generic 3GPP radiation envelope inferred per device, fast and conservative, ideal for planning and exclusion-zone scoping. A measured-pattern assessment uses imported OEM .msi / Planet patterns for the installed antennas, which is the basis for a definitive result. The tool shows which basis is in use (Screening, Mixed or Measured) and reflects it in the IEC 62232 uncertainty budget, where the antenna-pattern term is the dominant contributor.

How does the worker climb permit work?

The tool sweeps a vertical climb up every face of the structure (including each sector azimuth) and reports the worst face, the peak percentage and the height it occurs at, so a climb is never judged from a single arbitrary side. Where the climb exceeds the limit, a route-wide solver returns the minimal set of sources to de-energise or reduce (in dB) to make the whole climb safe, forcing full isolation where the route passes a live aperture in the near field. The permit and the de-energise list are included in the report.

Does every result come with an uncertainty?

Yes. Each result carries a 95% confidence interval from a transparent IEC 62232 / GUM Type-B uncertainty budget (antenna pattern, EIRP, position, reference-level interpolation and field model), combined in quadrature and expanded by k = 2. The default half-widths are representative desktop-assessment values, clearly labelled as such, and the dominant antenna-pattern term shrinks when measured patterns are imported.

What is the audit digest for?

Reproducibility. Every assessment carries a SHA-256 audit ID derived from only the result-determining inputs plus the engine method version, with cosmetic and UI state excluded. The same physical assessment always produces the same ID, and any change that could move a number changes it, so a report can be regenerated and defended, or a discrepancy detected, from the ID alone.

How does co-location apportionment work, and is it a regulatory requirement?

Compliance at a shared site is cumulative across every operator's sources, but responsibility is per licensee, so site sharing arrangements allocate each operator a share of the limit. The tool groups transmitters by operator (auto-filled from the ACMA licensee on import), evaluates each group's contribution at the worst publicly-accessible point, and tests it against its allocated share (equal splits by default, or the custom percentages of your sharing arrangement), plus the limit headroom remaining for a prospective co-locator. The share scheme itself is contractual site policy, not a regulatory formula, and the tool says so: the regulatory verdict is always the cumulative total at or below 100% of the reference level.

Can it replace an on-site measurement survey or a certified assessment?

No. It is an IEC 62232-aligned modelling tool for planning, exclusion-zone scoping and desktop compliance, and it is deliberately conservative. A definitive sign-off should use measured antenna patterns and, where required, on-site measurement, and remains the responsibility of a competent assessor. The tool is ideal for scoping where a survey should focus, and it can import a survey CSV to report a modelled-vs-measured calibration offset.

What is the difference from the Antenna Power Density calculator?

The Antenna Power Density calculator answers the single-transmitter, single-distance question. The RF EME Exposure Modeller is the 3D, multi-transmitter, whole-site environment: it sums many sources, renders the exclusion zone spatially, imports the licensed set from ACMA, supports measured patterns, plans worker climbs, tracks named receptors, states an uncertainty, and produces a site compliance report with a reproducible audit ID. Use the calculator for a quick single-source number; use the modeller for a real multi-carrier site.

Further reading