Thermal noise calculation
Computes thermal noise using N equals kTB with k as the Boltzmann constant, T as physical temperature in Kelvin, and B as bandwidth in Hz. Reference is the IEEE standard 290 K. Spectral density N0 in dBm per Hz is reported alongside total noise power for the configured bandwidth. The standard reference value of minus 174 dBm per Hz at 290 K is surfaced explicitly so cross checking is direct.
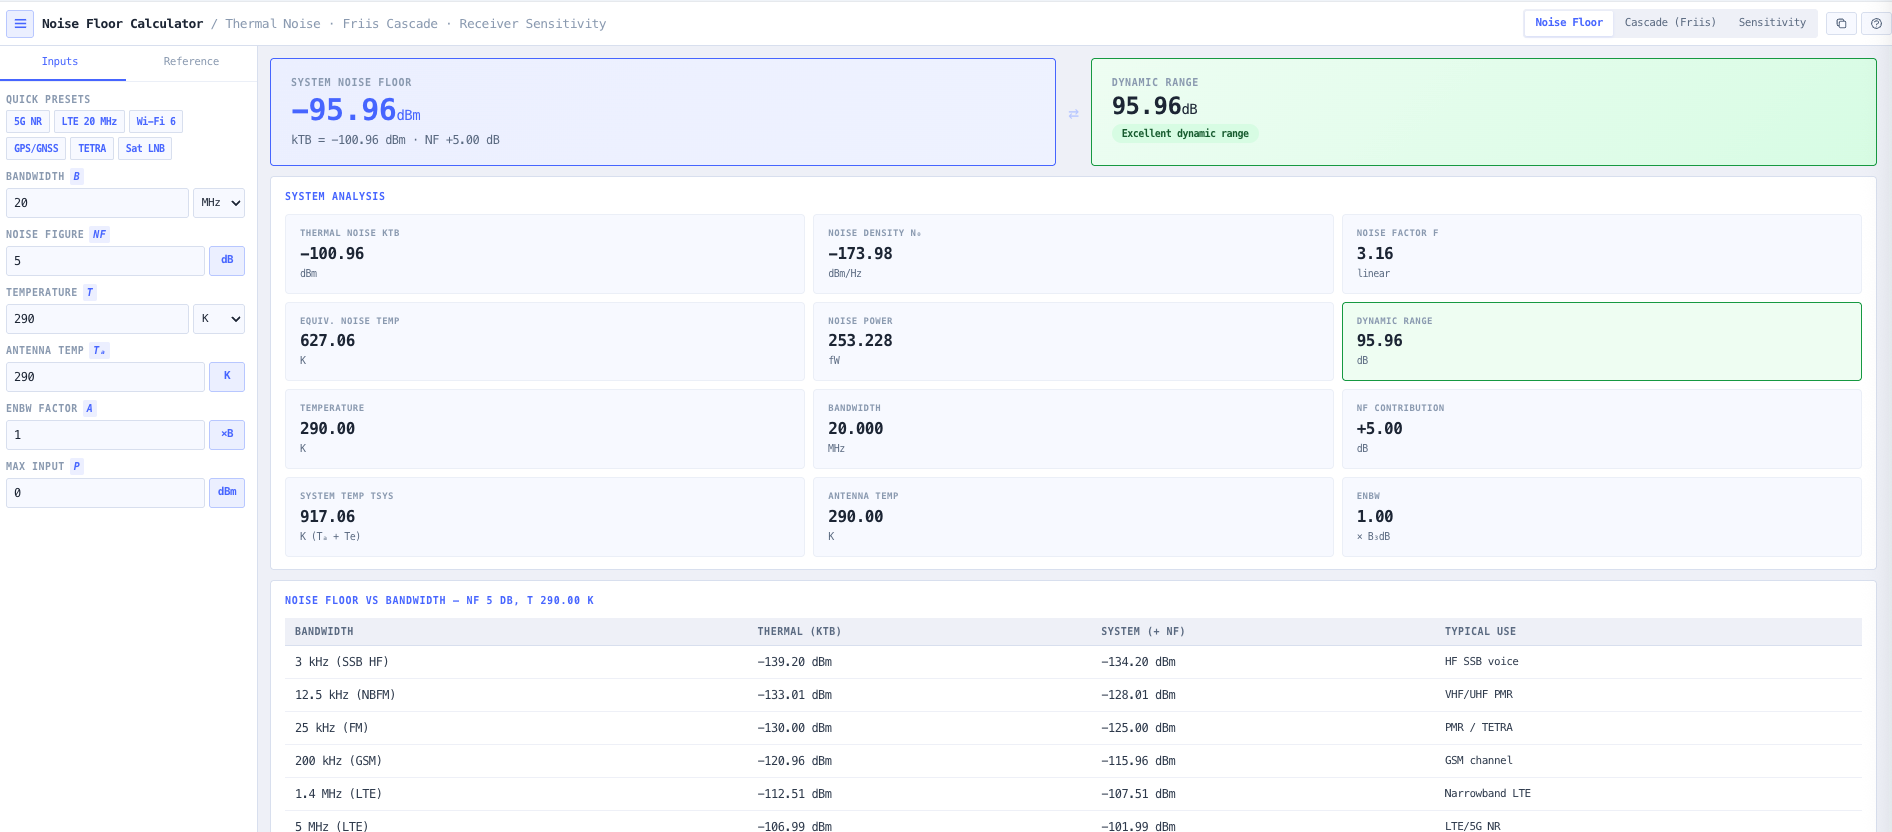
System noise floor with noise figure
Adds receiver noise figure contribution to thermal noise to compute overall noise floor. Noise floor in dBm equals minus 174 plus 10 log of bandwidth in Hz plus noise figure in dB. Output covers noise floor in dBm, thermal noise in fW (auto scaled to mW or microwatt as appropriate), equivalent noise temperature in K, and linear noise factor.
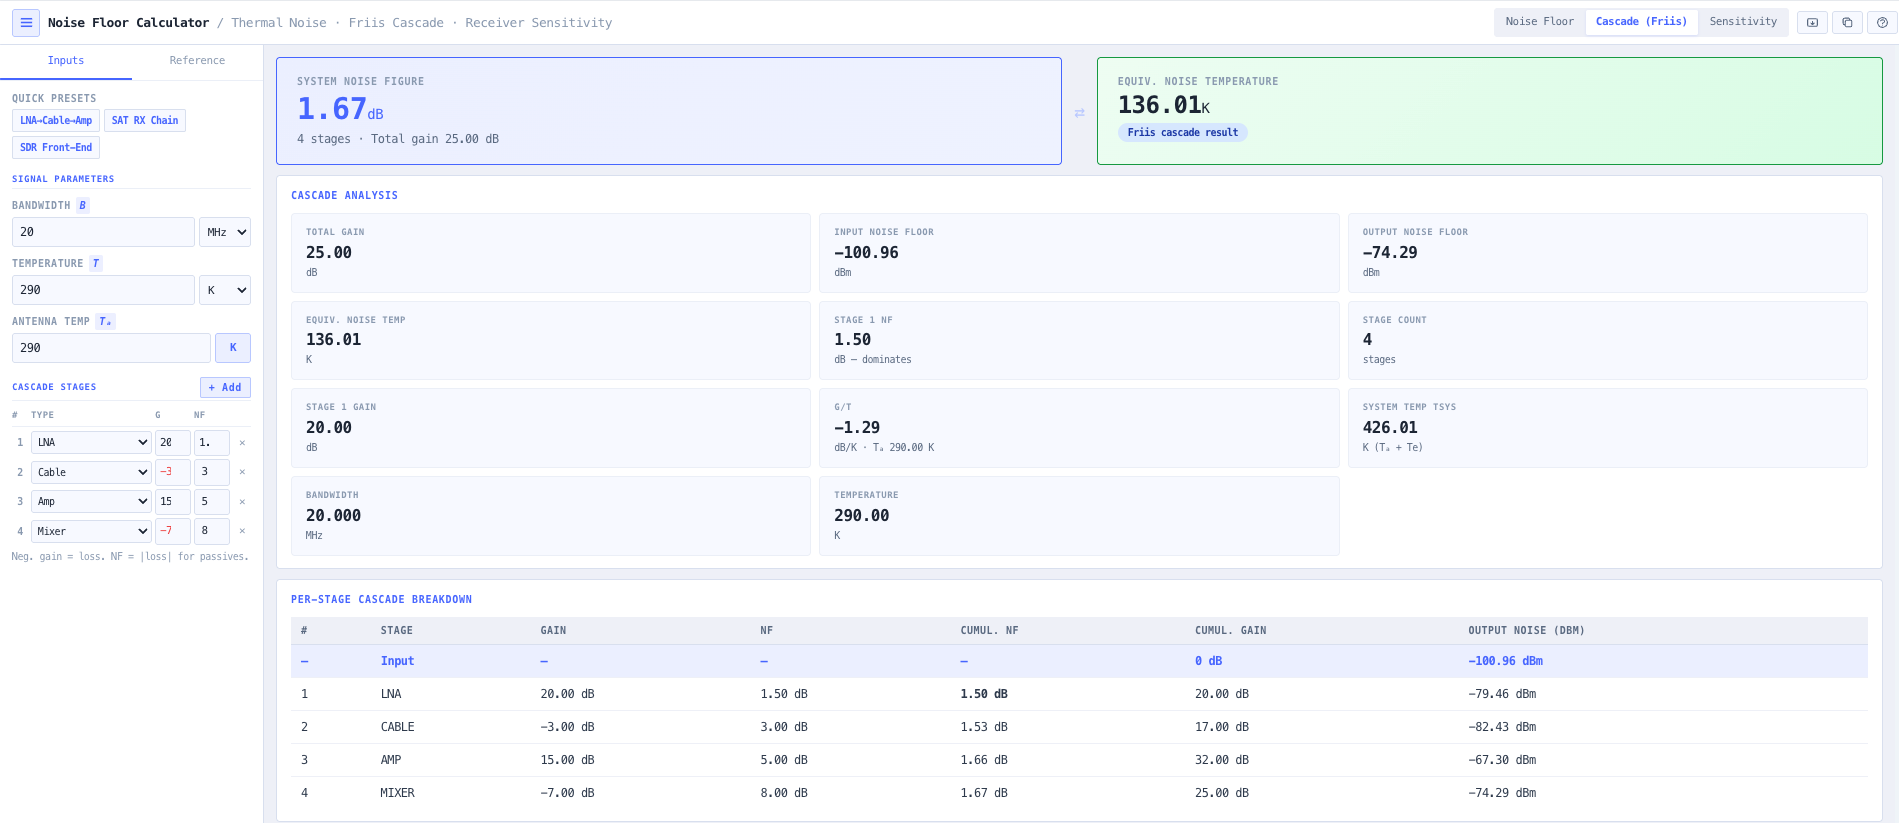
Friis cascade up to twenty stages
Multi stage receiver chains analysed using the Friis cascade formula. F equals F1 plus (F2 minus 1) over G1 plus (F3 minus 1) over G1 G2 and so on, supported up to twenty stages. Each stage accepts gain in dB and noise figure in dB or noise temperature in K. Identifies the dominant stage in the chain so design effort can target the actual bottleneck.
Antenna and sky temperature input
Antenna or sky noise temperature Ta in Kelvin can be configured directly or selected from common look angle scenarios for satellite work. System noise temperature Tsys equals Ta plus T0 (F minus 1) is computed and surfaced alongside the noise floor, supporting accurate satellite link budgets where antenna temperature varies with elevation.
G over T figure of merit
For satellite ground stations and radio astronomy work, the receiver gain G in dB divided by system noise temperature Tsys in K (expressed as G over T in dB per K) is computed and reported. G over T is the standard figure of merit for ground station capability and is the parameter operators benchmark against vendor and satellite operator specifications.
Equivalent noise bandwidth (ENBW) scaling
Real receivers have filters that are not perfect rectangles, so the equivalent noise bandwidth differs slightly from the 3 dB bandwidth used in datasheets. The calculator accepts an ENBW correction factor so the noise floor reflects the actual integrated noise across the receiver passband rather than only the rectangular approximation.
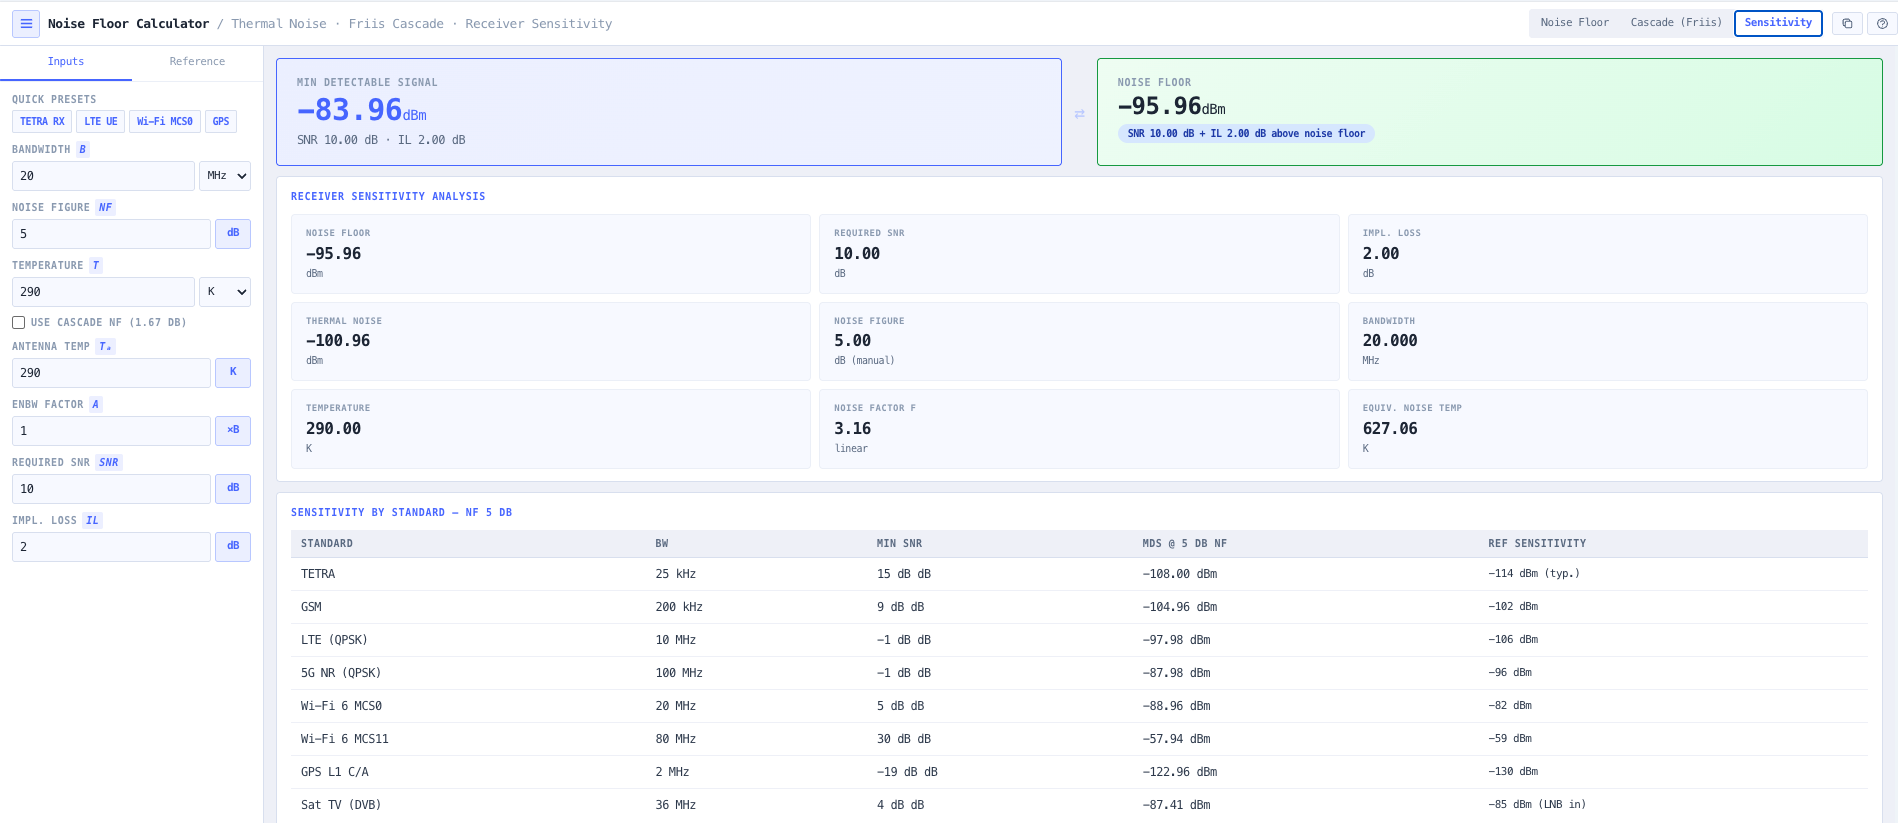
Dynamic range and minimum detectable signal
Computes system dynamic range from the maximum tolerable input power and the noise floor. Receiver minimum detectable signal (MDS) is reported as noise floor plus required SNR (typically 3 dB or 10 dB depending on application). Useful for sensitivity specification, intermodulation distortion analysis, and confirming the receiver has the dynamic range to handle both the smallest signal of interest and the largest interferer.
Band presets
Built in presets for LTE 20 MHz, 5G NR (numerologies 0 to 4), WiFi 6 (20, 40, 80, 160 MHz), GPS L1 and GNSS bands, TETRA narrowband, and satellite LNB configurations. Each preset populates bandwidth, noise figure, and reference temperature for the common configuration so a usable answer is one click away.
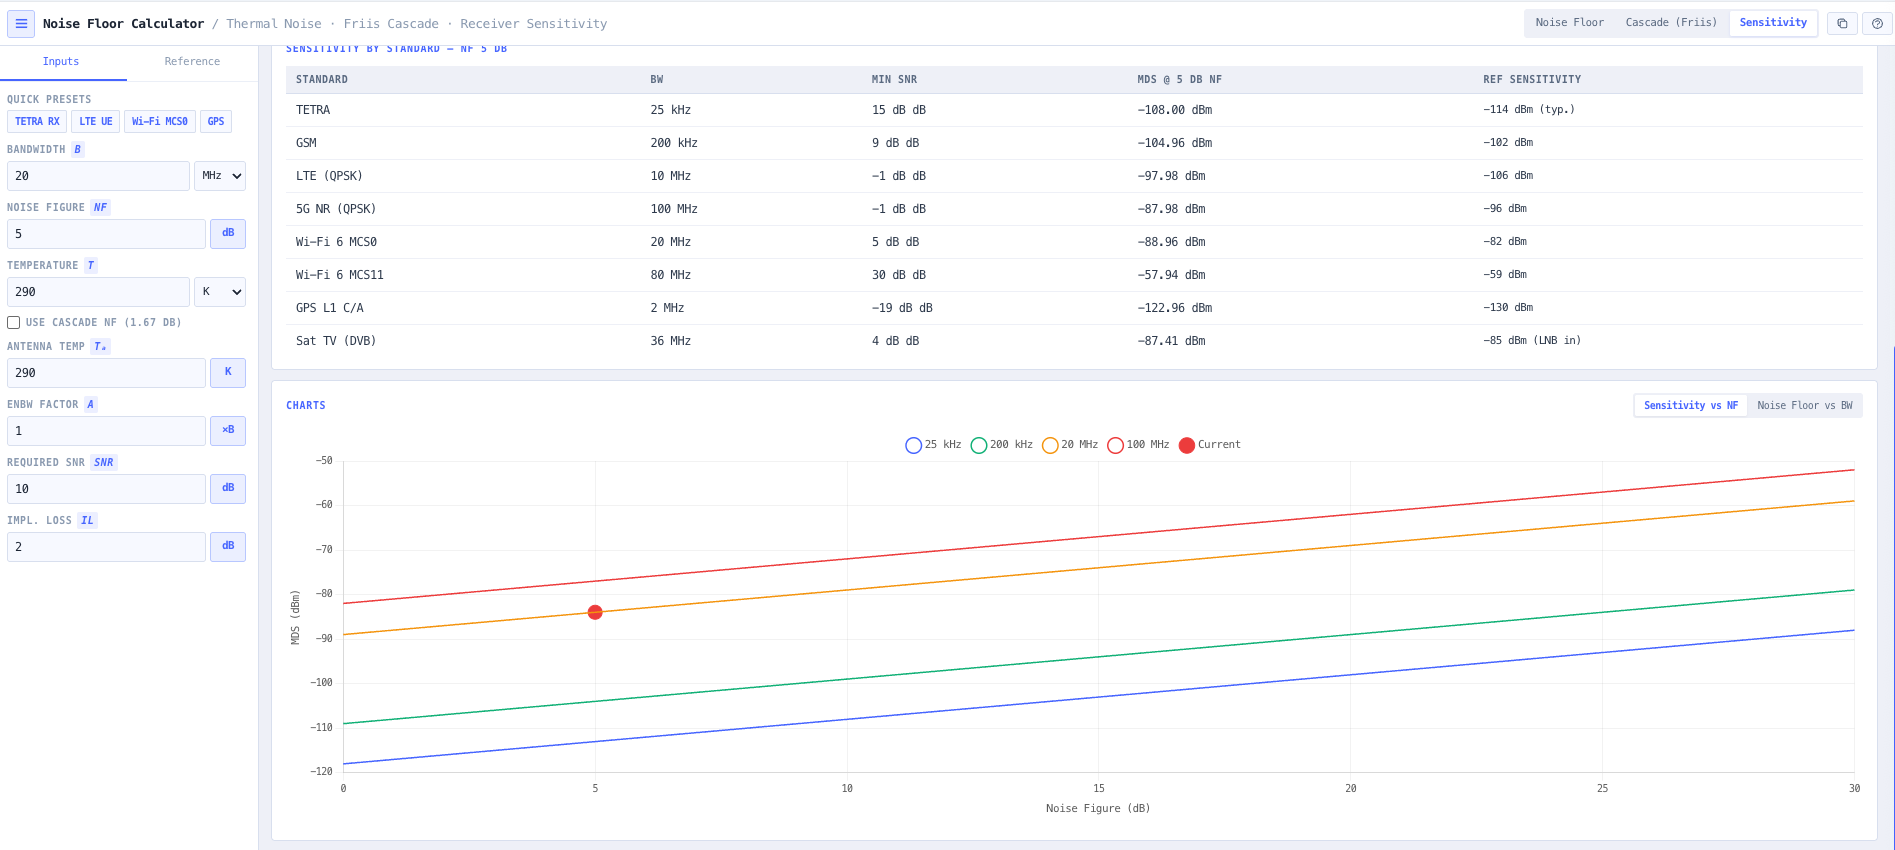
Visualisation
Interactive charts show noise floor versus bandwidth and noise floor versus physical temperature. Reinforces the intuition that a 10 fold bandwidth increase costs 10 dB of noise floor, and that thermal noise is roughly proportional to physical temperature in Kelvin (which is why cryogenic LNAs at 70 K rather than 290 K give about 6 dB of noise floor improvement).
Browser only computation
Runs entirely in your browser. No bandwidth, noise figure, or system data is submitted to a server. Useful for commercially confidential receiver design work, satellite ground segment, defence and intelligence installations, and environments where information security policy prohibits sending engineering data to third party services.