Microwave Link Planning

Rain Fade Reconstructor

Site specific fade reconstruction anchored to local BOM station climate. Apply ITU P.838 specific attenuation and P.530 path scaling to the live BOM rainfall window plus a climatological model anchored to the station BOM normals, producing modelled availability, outage hours per year, fade event statistics, and CCDF with explicit provenance and uncertainty bookkeeping.

Overview

Rain fade in microwave and millimetre wave links is well modelled by ITU P.530, which gives a statistical attenuation distribution against a single rain rate input R 0.01 from climatology. The trouble with that approach is that climatological rain rate is a 50 year average for a region. Real sites experience real weather. Some weeks see no rain at all. Some weeks see four heavy events that each take the link out for 20 minutes. Operators want to know what the link will do given what the local weather actually is, not what the regional climatological average suggests it should do. Vendor link planners give availability percentages and outage hours per year that are statistically correct for the climate zone but tell the operator nothing about which week of the year and which time of day the outages will happen.

The noIM₃ Rain Fade Reconstructor gives a different view. Take transmit and receive coordinates, frequency, polarisation, and an optional fade margin. Fetch the live BOM (Bureau of Meteorology) rainfall window for the nearest weather station. Apply ITU P.838 specific attenuation gamma R equals k times R to the power of alpha to convert rain rate to dB per km. Apply P.530 distance reduction factor r and effective path length d effective to scale to the actual path. Reconstruct the attenuation time series A(t) at 30 minute resolution from the live BOM 72 hour window, and model the longer history with a climatological stochastic model anchored to the station published BOM long term climate normals (mean annual rainfall, mean rain day count, seasonal shape), disaggregated to hourly intensity. The result is a site specific fade estimate anchored to the local climate, not the regional ITU climate zone average.

Honest uncertainty bookkeeping is a first class feature. Every chart carries a persistent provenance chip. Modelled regions of the time series are visually hatched. The CCDF includes a fixed warning that rainfall before the 72 hour BOM live window is a climatological model rather than measured observation. Provenance fractions (measured, modelled, gaps) are surfaced in the UI alongside surrogate station distance, which functions as the implicit spatial confidence indicator. Distance from the path midpoint to the surrogate station is rendered as a top level summary card with colour coded thresholds (under 15 km good, 15 to 40 km caution, over 40 km low confidence) so users see spatial confidence without needing to interpret it. The tool is transparent about what it actually is. A model output anchored to real local rainfall climatology, not measured RF data and not a back fill of real historical weather.

Capabilities

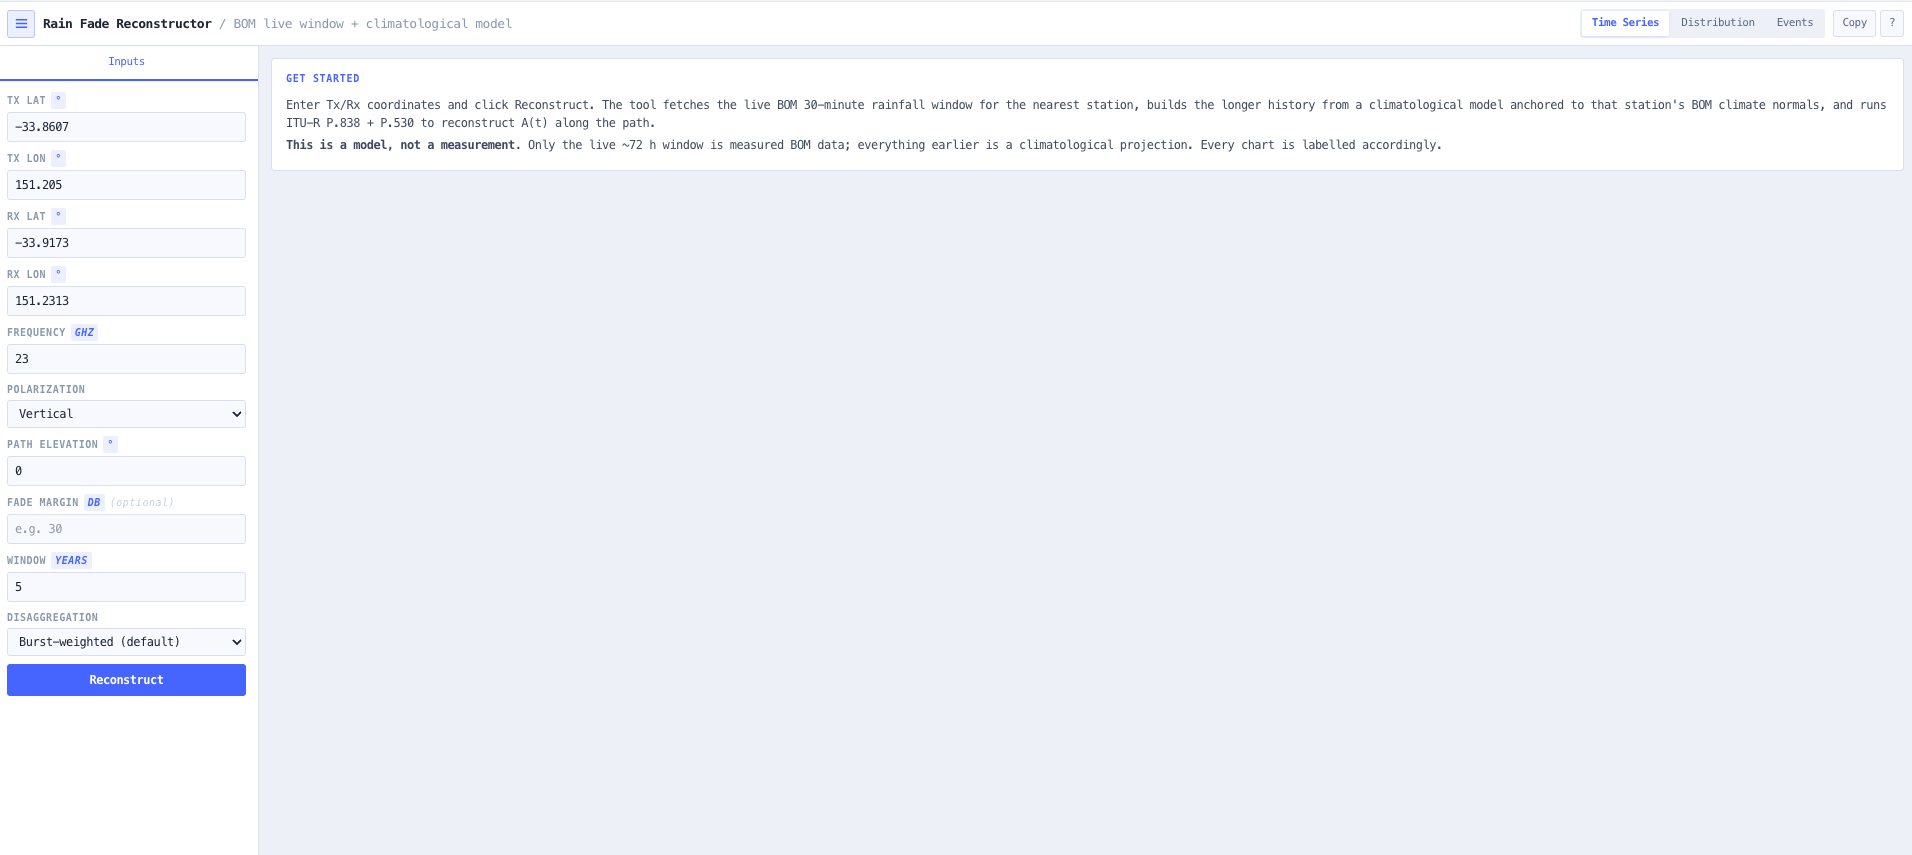
Modelled not measured

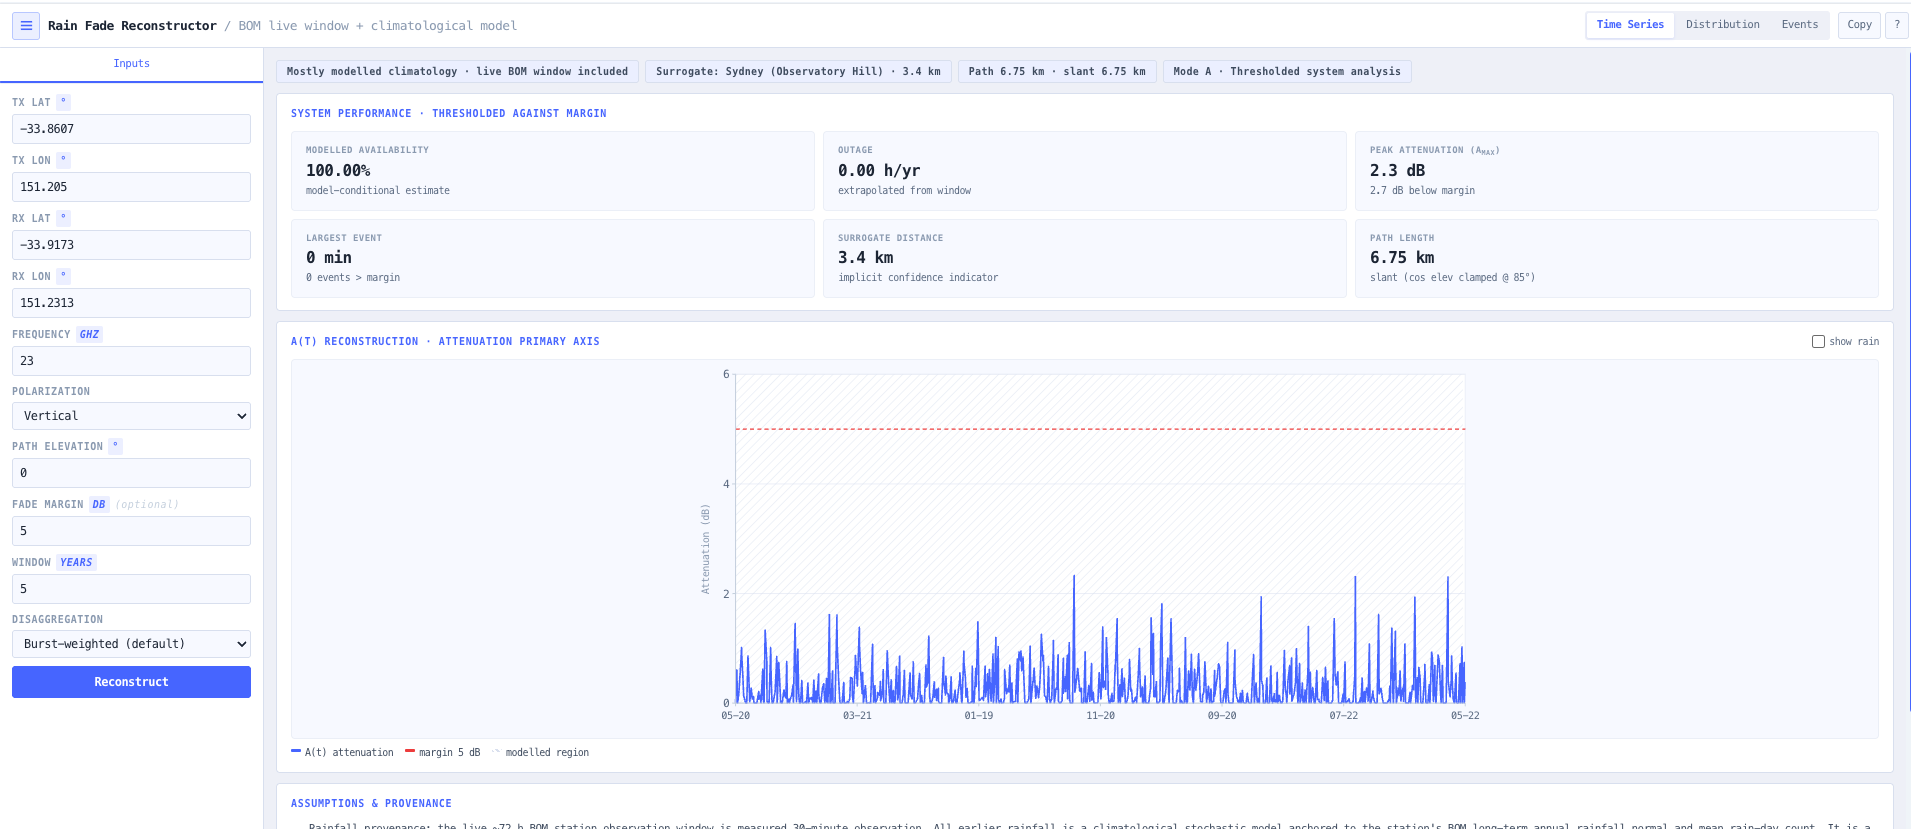
Every chart carries a persistent provenance chip making clear that the result is a model output anchored to local rainfall climatology, not measured RF performance from a deployed link. Modelled regions of the time series are visually hatched. The CCDF includes a fixed warning that rainfall before the 72 hour BOM live window is a climatological model rather than measured observation. The framing is deliberately honest so the output is not mistaken for measurement.

BOM rainfall integration

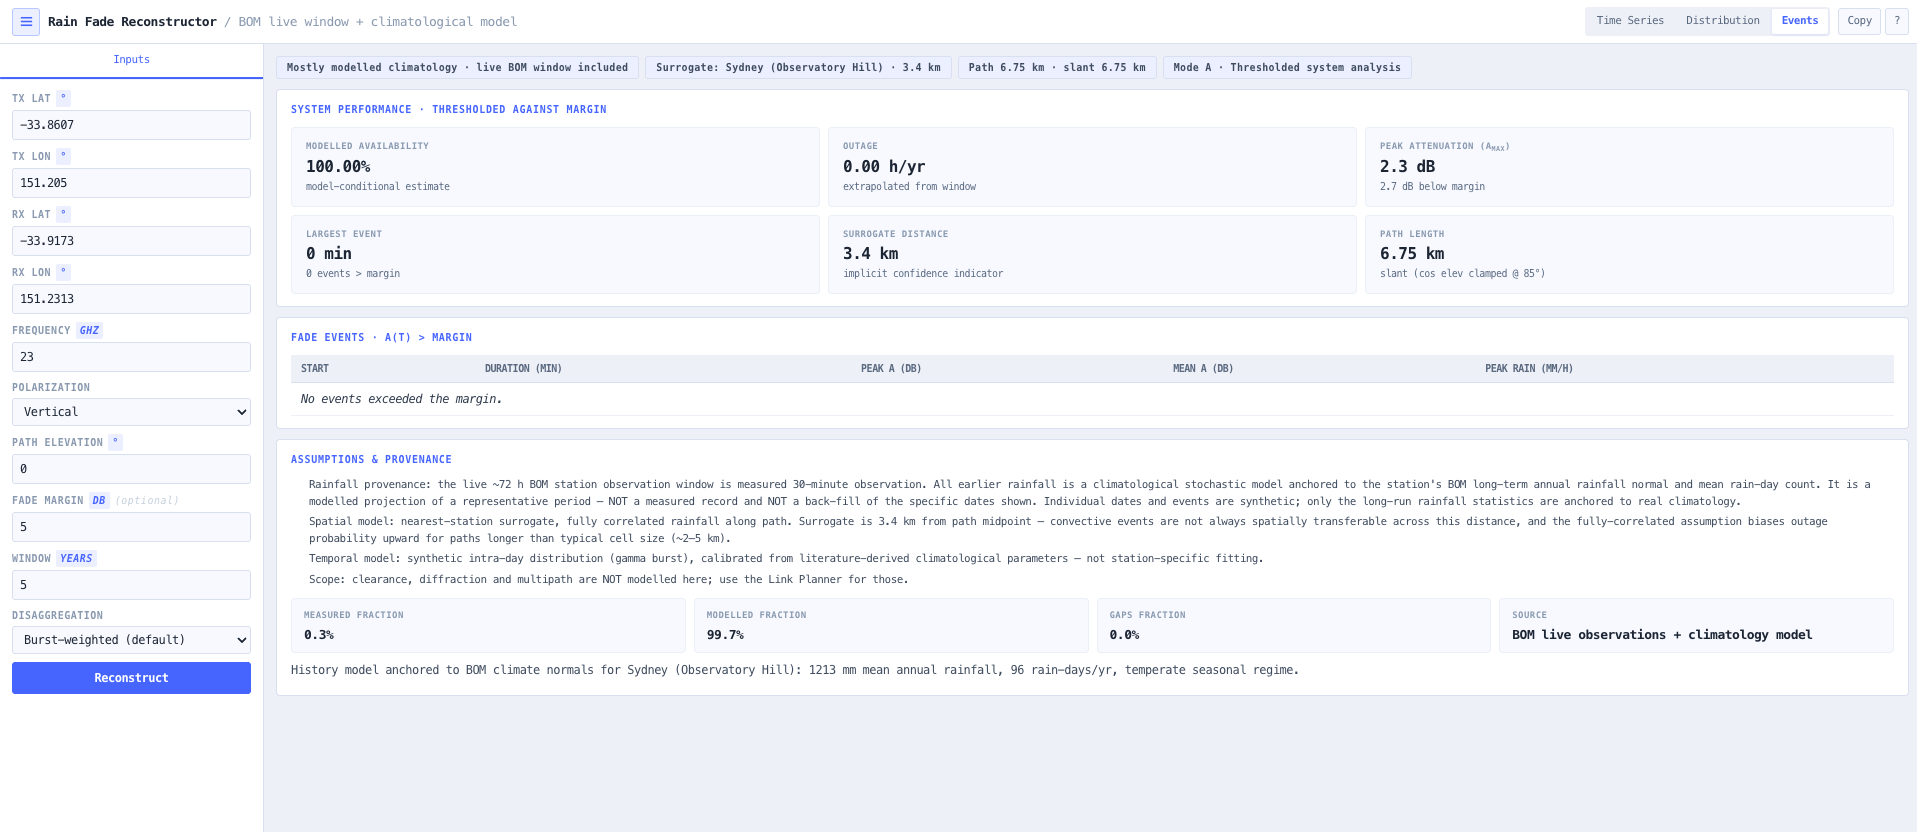
The roughly 72 hour BOM station observation window provides live measured 30 minute rainfall observations for the nearest weather station. The longer history is a climatological stochastic model anchored to the station published BOM long term climate normals (mean annual rainfall, mean rain day count, seasonal shape), disaggregated to hourly intensity via burst weighted disaggregation. It is a modelled projection, not measured data. Source provenance for each segment of the time series is surfaced explicitly so the engineering record is traceable.

Attenuation only fade event extraction

Fade events are defined strictly on A(t) greater than margin crossings, where A(t) is the reconstructed attenuation in dB and margin is the configured fade margin. Rain rate thresholds play no role in event boundaries. Peak rain during the event is reported but is informational only. The result is fade event statistics (count, duration, peak attenuation, total outage time) tied directly to the operational impact rather than to a rainfall metric.

Nearest station surrogate model

Single station fully correlated rainfall along the path. Distance from the path midpoint to the surrogate station is rendered as a top level summary card with colour coded thresholds. Under 15 km is good (rainfall is likely representative of the path). 15 to 40 km is caution (rainfall may differ between station and path during convective events). Over 40 km is low confidence. Users see spatial confidence without needing to interpret it.

Burst versus uniform disaggregation

Default disaggregation mode is event preserving burst weighted (gamma shaped intra day distribution) which preserves the heavy peaks that drive fade events. Uniform smoothing is available as a conservative mode and is explicitly labelled as biasing peaks downward (and therefore underestimating fade events). The choice is exposed and labelled rather than hidden inside a black box.

Slant geometry with low elevation clamp

Path length uses slant length d divided by cos of elevation, with cos clamped at 85 degrees for numerical safety. The clamp is surfaced as an explicit warning in the assumptions panel when triggered, so unusually steep paths do not silently produce nonsense results. Useful for satellite earth station and high tower terrestrial geometries.

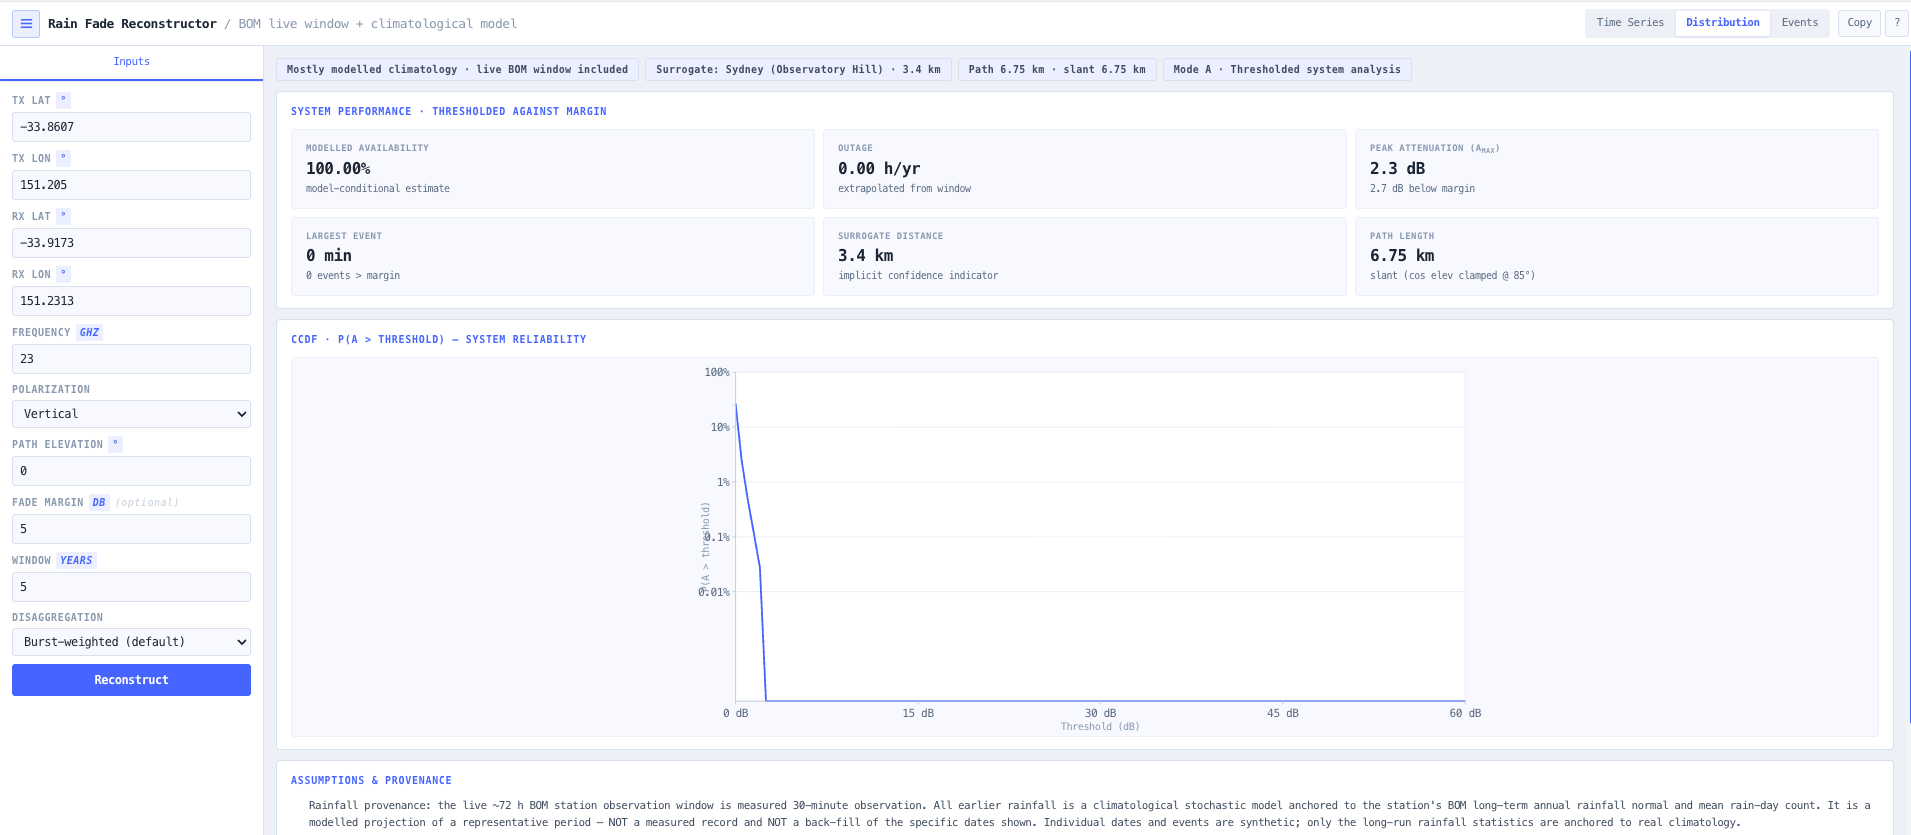
CCDF with extrapolation labelling

Complementary cumulative distribution function of A(t) on a logarithmic time percent axis. Sub daily resolution segments are visually labelled as reconstructed. The CCDF supports availability sizing (99.9, 99.99, 99.999 per cent targets) directly from the reconstructed local data, with the model conditional caveat preserved in the chart.

Copy paste engineering summary

One click emits an engineering snippet that leads with the model conditional caveat, then provenance fractions, then the numbers (modelled availability, outage hours per year, peak fade event, fade event count, CCDF percentiles). Designed for honest paste into design documents and customer reports rather than for cherry picking favourable numbers.

Browser plus BOM lookup

The reconstruction itself runs in your browser. The BOM lookup queries the Bureau of Meteorology weather station network anonymously for rainfall observations. No identifying information about the planned link or design is transmitted. Useful for commercially confidential infrastructure planning where the calculation must stay local but climatology data can be retrieved openly.

Standards & methodology

  • ITU R P.838. Specific attenuation model for rain
  • ITU R P.530. Propagation data and methods for terrestrial line of sight systems
  • BOM per-state station observation products for Australian 30 minute rainfall observations
  • Burst weighted (gamma shaped) intra day disaggregation calibrated from climatological literature

When to use this tool

  • Site specific fade reality check against vendor link planner output
  • Sizing fade margin against historical Australian rainfall rather than ITU climate zones
  • Sanity checking outage estimates with explicit uncertainty bookkeeping
  • Australian microwave and millimetre wave site planning grounded in BOM observations
  • Producing post incident analysis of fade events that correlate with measured rain history
  • Producing customer evidence that a proposed link will meet availability targets in the local climate
  • Comparing two candidate sites against actual local rainfall history rather than climatological averages
  • Sizing fade margin for a high availability link in tropical Australian climate
  • Validating that a link surviving the BOM 72 hour live window has adequate margin for the weeks ahead
  • Auditing an inherited link against actual local rainfall climate rather than the original design assumption
  • Producing teaching examples that show the difference between climatological and local rainfall rain fade
  • Quantifying peak fade events from convective rainfall for safety critical link design

Is this the right tool for you?

Reach for the Rain Fade Reconstructor in any of the following situations.

  • You are sizing a microwave or millimetre wave link in Australia and want a site specific fade reconstruction grounded in local BOM rainfall rather than ITU climate zone averages.
  • You are validating a vendor link planner output that promises a particular availability number and want to see what the same link would experience under local rainfall history.
  • You are conducting post incident analysis of a fade event on a working link and want to overlay the reconstructed A(t) against the time of the reported failure.
  • You are producing customer evidence that a proposed microwave link will meet a contractual availability target in the local climate and need site specific reconstruction with provenance.
  • You are comparing two candidate sites for the same backhaul link and need a side by side rainfall climatology comparison anchored to each local BOM station rather than a single regional climate zone average.
  • You are sizing fade margin for a high availability link in tropical northern Australia where rain rate is much higher than the southern temperate climate and ITU climate zone averages may not capture the local extreme events.
  • You are responsible for an existing microwave network and want to confirm whether the original design fade margin still holds against the most recent rainfall history, or whether climate trends have changed the picture.
  • You are diagnosing a microwave link that has been failing more often than the vendor planner predicted and want to see whether local rainfall is the cause.
  • You are auditing a series of inherited microwave links across a national operator portfolio against local BOM station rainfall climatology rather than the single climate zone assumption used in the original design.
  • You are evaluating whether a working link that survived the live 72 hour BOM window will likely survive the next several weeks against the synthetic reconstruction extending beyond the live window.
  • You are producing teaching materials that demonstrate the difference between climatological rain fade calculation and locally reconstructed rain fade for the same path.
  • You are responsible for safety critical or emergency services microwave links where peak fade events from convective rainfall must be quantified specifically rather than treated only statistically.
  • You are responding to a customer enquiry about why their link is failing during certain weather conditions and need to confirm whether the rainfall causing the failures is consistent with the design fade margin.
  • You are operating in a region where ITU P.837 latitude band climatology is known to underestimate local rainfall (particularly tropical or monsoon affected areas) and need a reconstruction anchored to the local BOM station climate normals.
  • You are operating under a security regime where calculation must stay local but acknowledge that BOM rainfall data retrieval is open and not sensitive.

Frequently asked questions

How is this different from the Rain Fade Calculator?

The Rain Fade Calculator computes statistical rain fade against an ITU P.530 climatological rain rate (single number R 0.01 from latitude band lookup or manual input) and returns probability based attenuation A p at a configured availability target. The Rain Fade Reconstructor reconstructs the time series A(t) for a specific site, anchored to the nearest BOM station: the live measured 72 hour window plus a climatological model built from that station long term BOM climate normals. Use the Rain Fade Calculator for fast climatological sizing during early link planning. Use the Rain Fade Reconstructor for site specific fade analysis anchored to the local station climate.

Is this a measured RF result?

No. It is a model reconstruction conditioned on real local rainfall. The reconstruction applies ITU P.838 specific rain attenuation and P.530 distance reduction factor to BOM rainfall observations. Useful as a site specific reality check on vendor link planner output and as a defensible substitute for climatological rain fade where local rainfall is genuinely different from the latitude band average. Not a substitute for measured RF data from a deployed link.

How is the time series reconstructed?

The roughly 72 hour BOM live observation window provides measured 30 minute rainfall observations directly. The longer history (the years before the live window) is a climatological stochastic model: daily rainfall totals are generated by a deterministic model anchored to the station published BOM long term climate normals (mean annual rainfall, mean rain day count, and a documented seasonal shape), then disaggregated to hourly intensity. It is a modelled projection of a representative period, not measured data and not a back fill of the specific calendar dates. The disaggregation preserves event peaks rather than smoothing them. Provenance fractions (measured, modelled, gaps) are surfaced in the UI per segment so the engineering record is traceable.

What is the surrogate station distance?

Distance from the path midpoint to the nearest BOM weather station whose rainfall data is being used. Functions as a spatial confidence indicator. Under 15 km is good (rainfall at the station is likely representative of the path). 15 to 40 km is caution (rainfall may differ during convective events). Over 40 km is low confidence (use the result with engineering judgement rather than as definitive). Rendered as a top level summary card with colour coded thresholds.

Why are there two disaggregation modes?

Burst weighted disaggregation (default) uses a gamma shaped intra day distribution that preserves event peaks, which is what drives fade events. Uniform disaggregation spreads the daily total evenly across the day, which smooths the peaks downward and underestimates fade events. Burst weighted is the realistic mode. Uniform is available as a conservative cross check and is explicitly labelled as biasing peaks downward.

How are fade events defined?

Strictly on A(t) greater than margin crossings, where A(t) is the reconstructed attenuation in dB and margin is the configured fade margin. Rain rate thresholds play no role in event boundaries. Peak rain rate during the event is reported but is informational only. Output covers event count, individual event durations, peak attenuation per event, and total outage time across the reconstruction window. Useful for fleet level fade event statistics and for post incident analysis.

How does this support the Link Planner?

The Rain Fade Reconstructor is a focused diagnostic tool for site specific fade analysis. The noIM₃ Link Planner is the full ITU anchored RF planning workstation with terrain accurate path profiles, automatic ITU model coverage (P.526, P.530, P.676, P.838, P.840, P.2108), Fresnel zone clearance, multi link projects, and full provenance for every input. Use the Reconstructor for fade reality check against historical local rainfall. Use the Link Planner for full microwave link design and ACMA submissions.

Does any data leave my browser?

The reconstruction itself runs in your browser. The BOM lookup queries the Bureau of Meteorology weather station network anonymously for rainfall observations. No identifying information about the planned link or design is transmitted to anything other than the public BOM service. Useful for commercially confidential infrastructure planning where the calculation must stay local while acknowledging that public rainfall data retrieval is open.