Reference Data

Component Catalogue

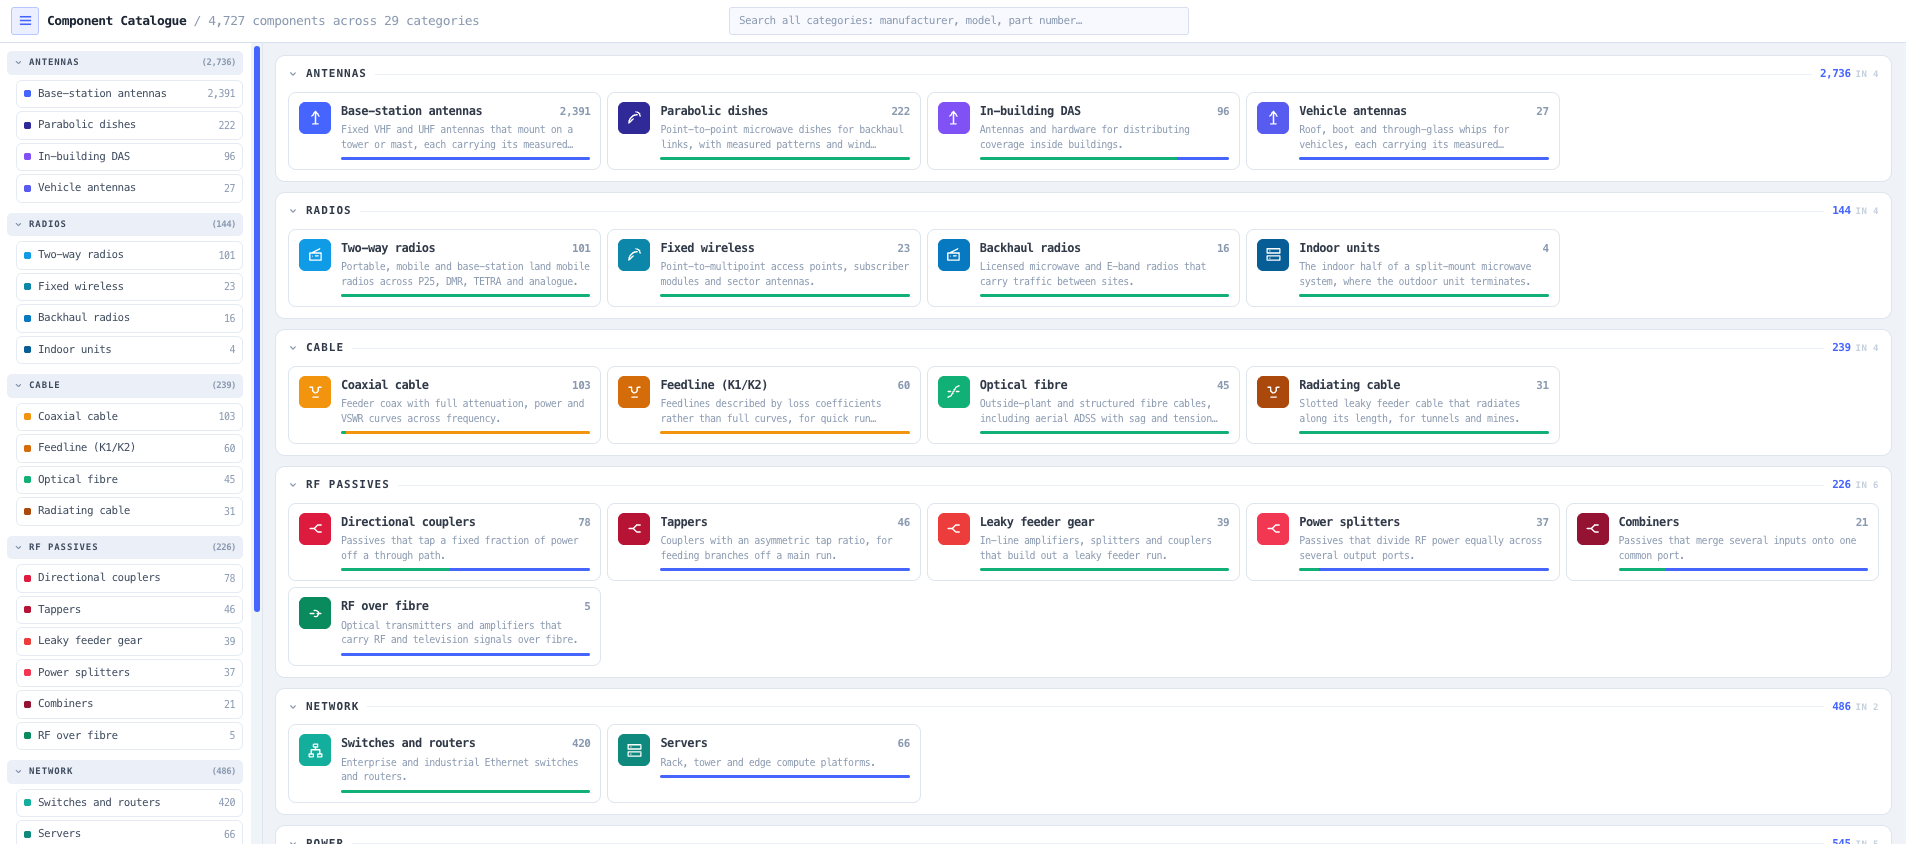
Browse the component library behind the noIM3 tools. 4,727 real parts across 29 categories, with measured antenna patterns and honest provenance on every field.

Overview

Every engineering tool on noIM3 reads from one shared component library. The Coverage Predictor picks its base-station antennas from it, the Link Planner picks its radios and parabolic dishes from it, the BESS Designer picks its batteries and inverters from it. The Component Catalogue is that library, opened up so you can read it directly.

It is deliberately not a datasheet mirror. It hosts no manufacturer PDFs and links to no external sites, because a worse copy of a manufacturer datasheet is not worth building. What it offers is what a folder of thirty PDFs cannot: one normalised shape across thirty manufacturers, the measured radiation pattern behind an antenna rather than a modelled envelope, and a clear statement of how much each number can be trusted.

That last part matters most. Roughly a quarter of the library is extracted directly from manufacturer datasheets, about half is derived from measured antenna pattern sets, and a small remainder carries no attribution at all. The catalogue tells you which is which on every row, and where a field was left empty it usually records the reason. Nothing is filled in with a plausible guess.

Capabilities

4,727 real components across 29 categories

LMR and microwave antennas, mobile and vehicular antennas, LMR radios, fixed-wireless backhaul and PMP equipment, coaxial and radiating (leaky feeder) cable, RF passives (splitters, couplers, tappers, combiners), DAS equipment, optical fibre, optical transport, network switches and routers, servers, CCTV cameras and NVRs, access control, batteries, DC power equipment, inverters, UPS, solar panels and air conditioning. Each is a real, orderable part rather than a generic placeholder.

Columns derived from the data, not a fixed template

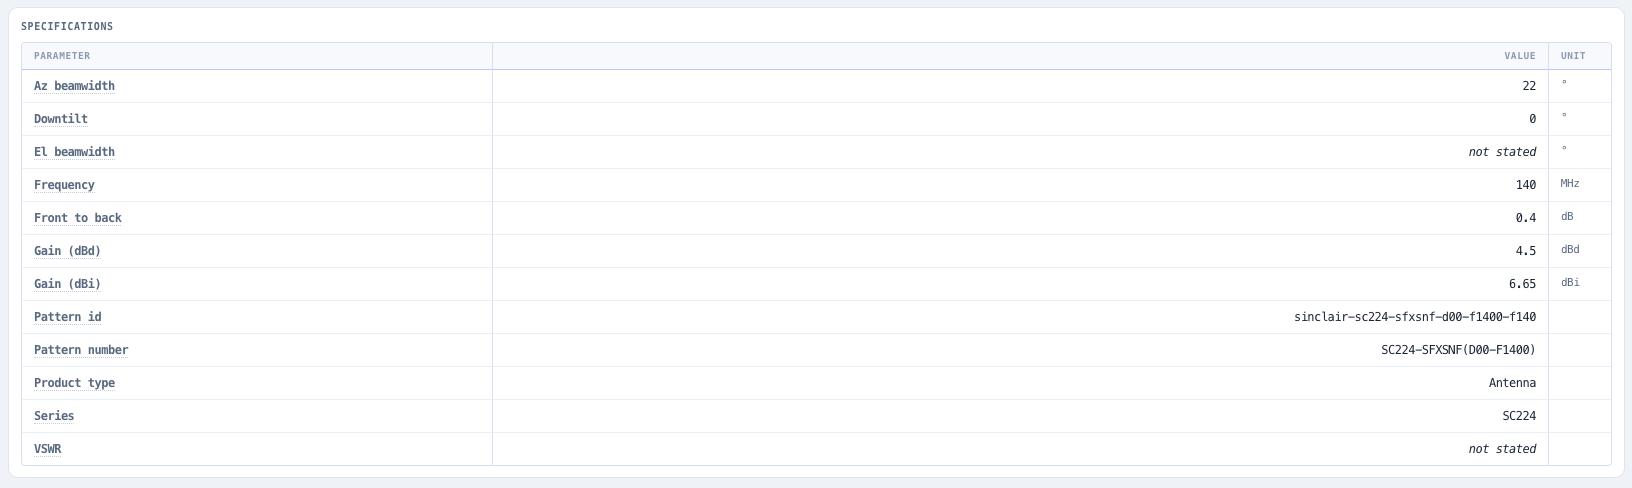
Manufacturers do not agree on what a datasheet contains, and neither do categories: one has 36 fields populated on nearly every row, another has nine. Rather than force a template, each category derives its table columns from the fields actually present, dropping the ones that are always empty and the ones that never vary. Filters and facets are built the same way.

Interactive measured radiation patterns

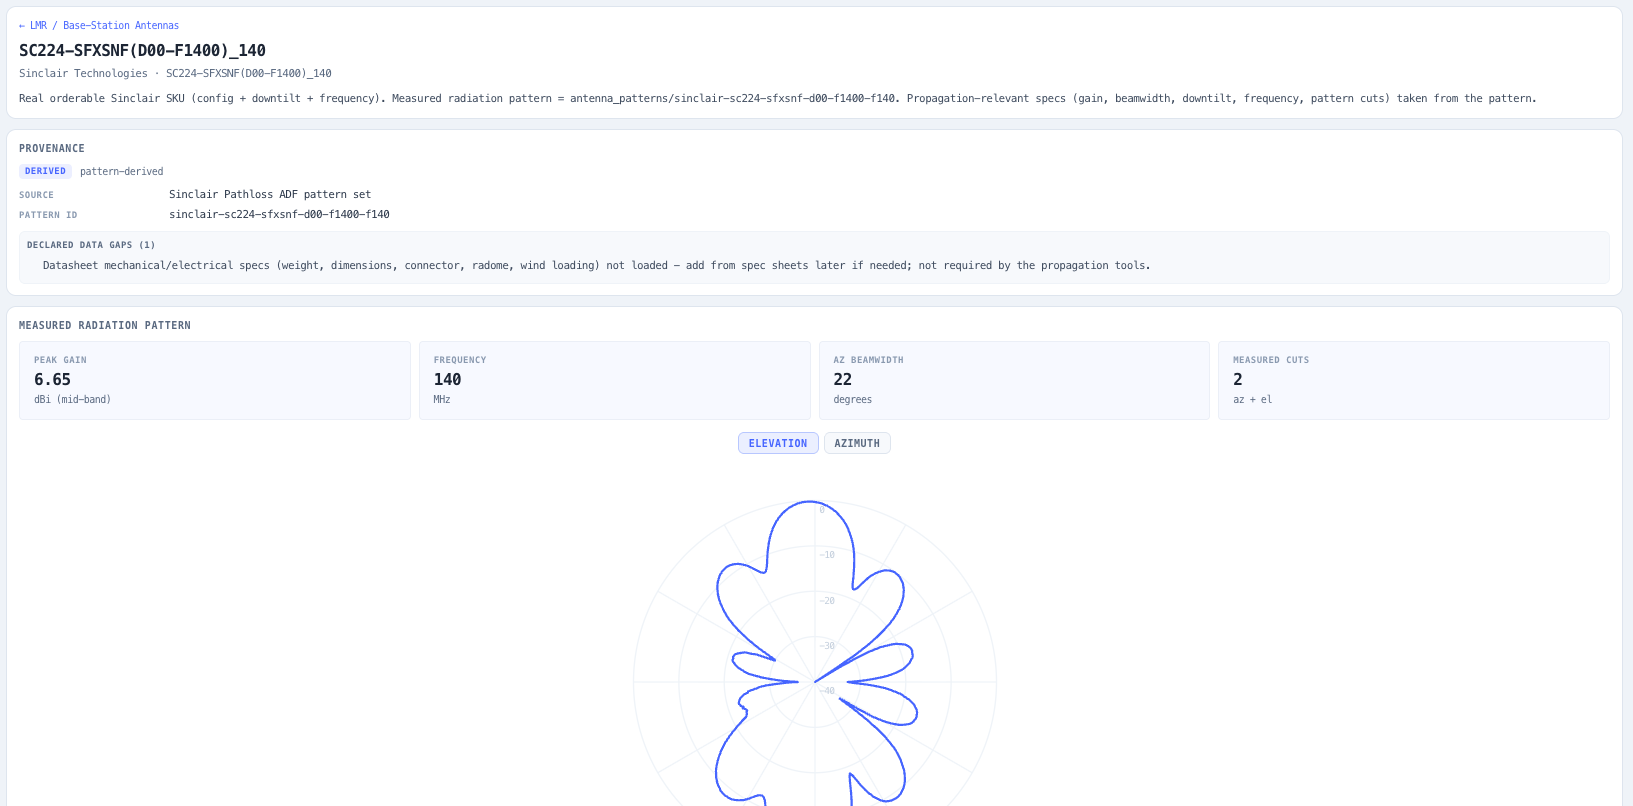
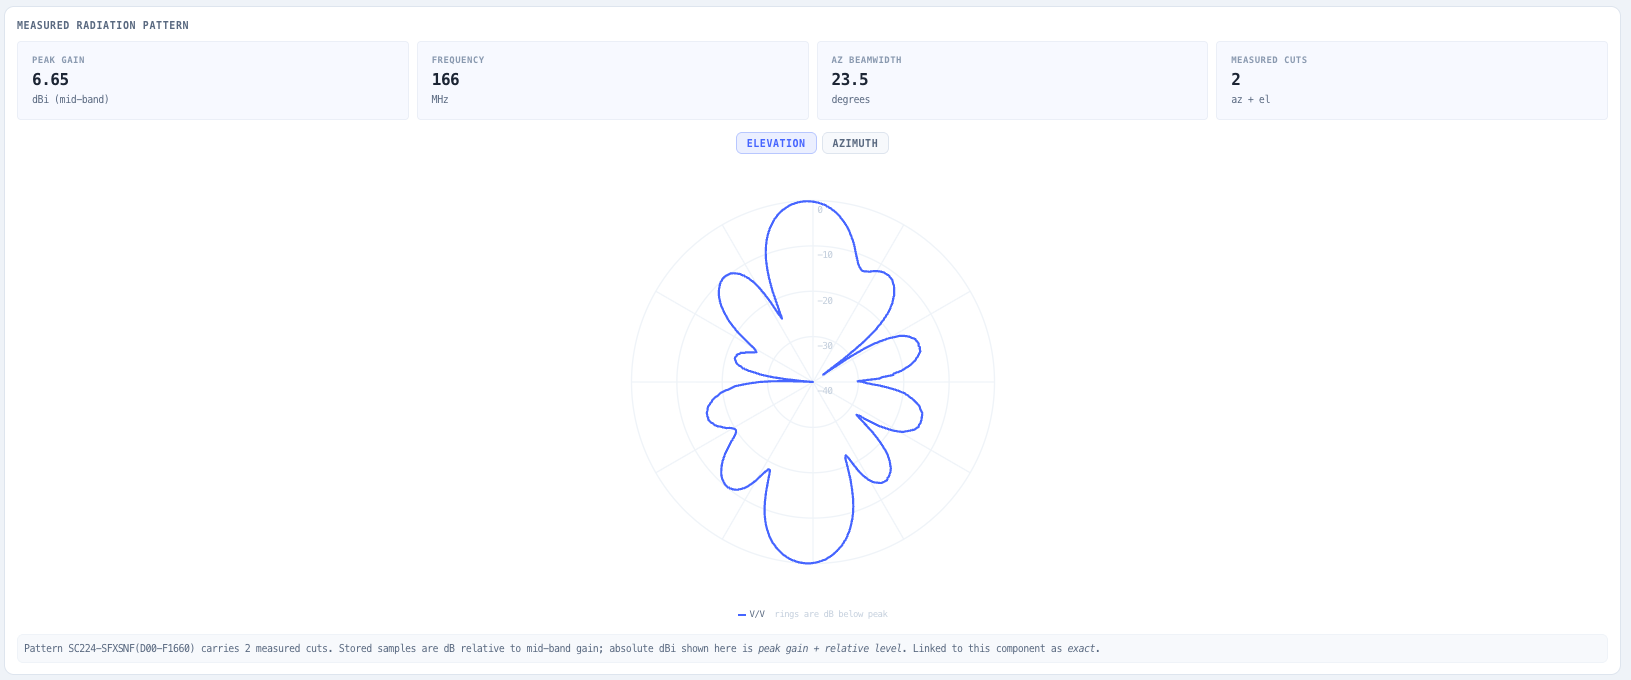
2,657 components carry a real measured antenna pattern rather than a modelled envelope. Each opens as an interactive polar plot with azimuth and elevation cuts, co-polar and cross-polar traces, peak gain, band edges and beamwidth. Stored samples are dB relative to mid-band gain; the plot reports absolute dBi as peak gain plus relative level.

Provenance on every row, including the gaps

Each component states whether its values were extracted from a datasheet, derived from a measured pattern set, or carry no attribution. Where an extraction note exists it is shown verbatim, including the reasoning for a field being left empty. 2,768 rows carry explicitly declared data gaps, and the catalogue shows them instead of hiding them.

Antenna families, not a wall of near-duplicates

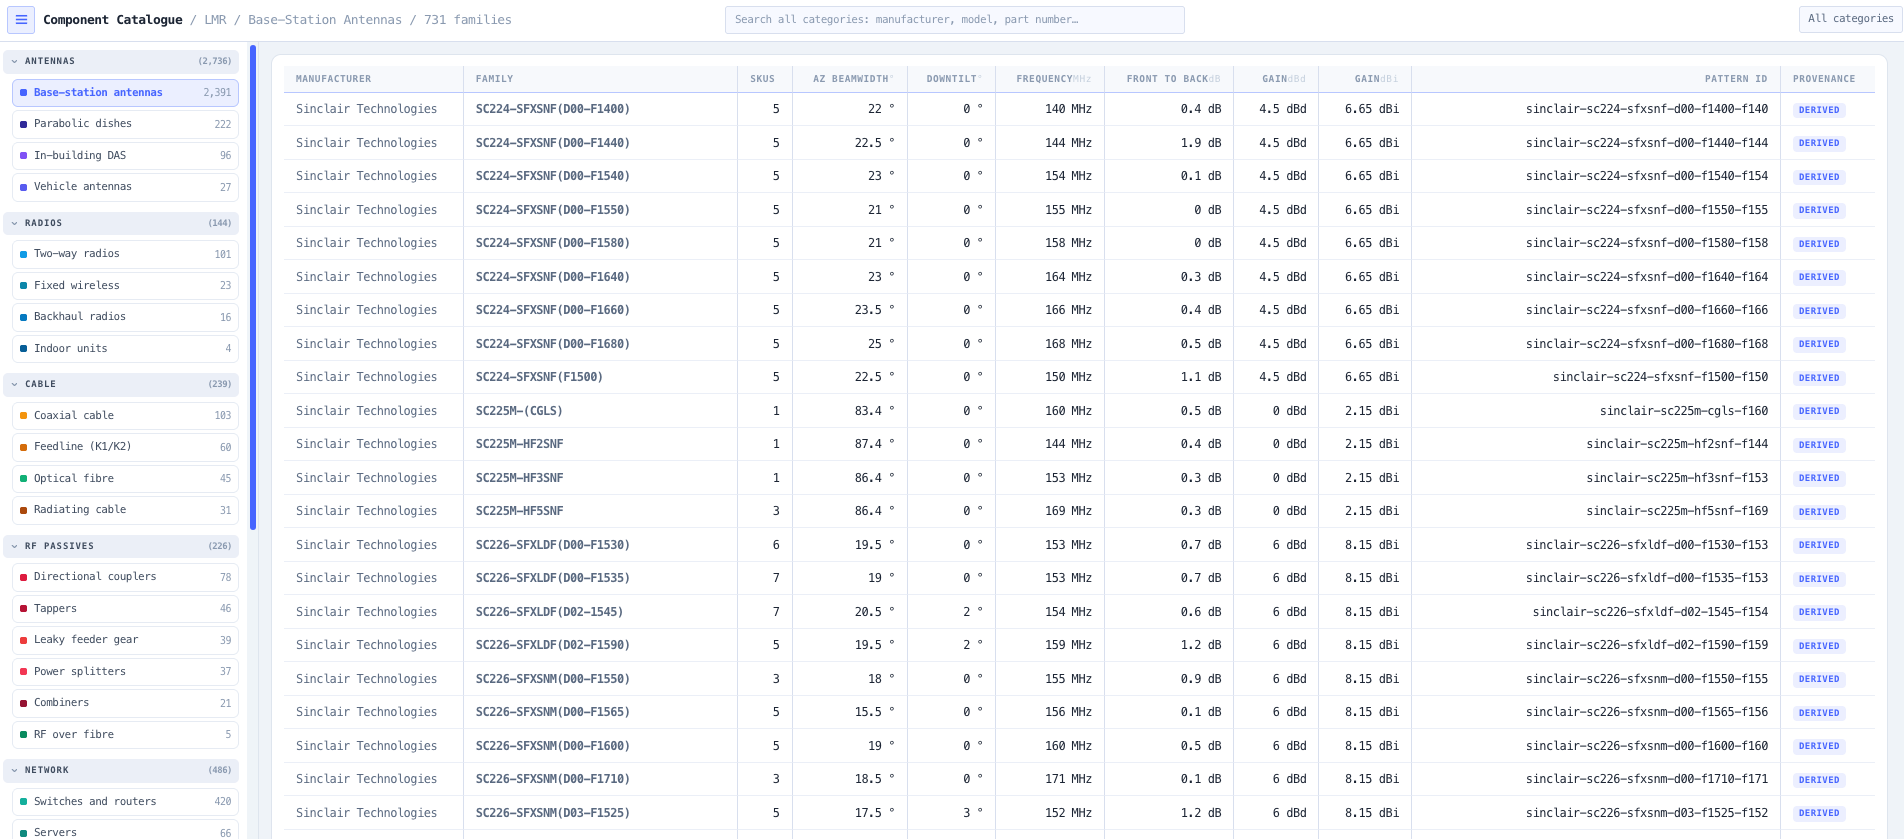
Base-station antennas are stored one row per orderable SKU, which means the same configuration repeats once per tuned frequency. The catalogue groups those into pattern families, collapsing 2,391 SKUs into 731 configurations, so you browse configurations and expand to the tuned frequencies underneath.

Search across every category at once

Search by manufacturer, model, part number or description across the whole library from one box. If all you have is the label on a box, that is enough to find the row.

Standards & methodology

  • Radiation patterns stored as measured antenna pattern files from the manufacturer pattern libraries
  • Pattern samples stored as dB relative to mid-band gain; absolute gain is peak gain plus relative level
  • Values are datasheet-verbatim where a datasheet was the source, including qualified figures

When to use this tool

  • Compare candidate parts across manufacturers on a like-for-like basis
  • Inspect an antenna radiation pattern before committing to a coverage design
  • Check what a catalogue row actually claims before specifying it on a project
  • Find a component by part number when all you have is the label on a box
  • Establish which values are datasheet-backed and which are derived
  • Review what a component record does not contain before relying on it

Frequently asked questions

Is this a datasheet library?

No, and deliberately so. The catalogue holds no manufacturer PDFs and links to no external sites. It holds the engineering parameters the noIM3 tools consume, normalised into one shape, plus the measured antenna patterns behind them. For the full mechanical drawing or the manufacturer warranty terms you still want the manufacturer document.

How much of the data is datasheet-backed?

About 23% of rows are extracted directly from a manufacturer datasheet with no declared gaps. Around half are derived from measured antenna pattern sets, which carry the propagation parameters and the pattern but not mechanical or environmental specifications. A small remainder, chiefly some coaxial cable rows, carry no provenance record at all and are labelled unsourced. Every row shows which of these it is.

What does a "declared data gap" mean?

It means the record explicitly states that a field was not loaded, and often why. For example a controller variant that has no product code printed in the manufacturer ordering table will record that its part number was left empty for that reason, rather than having a plausible-looking code filled in. 2,768 of the 4,727 rows carry at least one declared gap.

Why do some antennas show thousands of near-identical models?

Base-station antennas are stored one row per real orderable SKU, and a single configuration is sold tuned to many different frequencies. Rather than list every SKU flat, the catalogue groups them by radiation pattern into families and lets you expand a family to see its tuned frequencies.

Are the radiation patterns measured or modelled?

Measured. They come from the manufacturers' own antenna pattern libraries, not from a modelled envelope. Each pattern carries its cuts as sampled points, and the plot draws those points rather than fitting a curve to a beamwidth figure.

Can I export the data?

Not from this tool. It is a viewer over the library that the other noIM3 tools consume. Those tools read the same rows directly, so a part you find here is already available in the Coverage Predictor, Link Planner, BESS Designer and the rest.