Private Cellular

LTE Cell Range & Coverage Estimator

Cell range from a maximum allowable path loss under ten propagation models at once: 3GPP TR 38.901 RMa, UMa and UMi in LOS, NLOS and blended, plus a validated Okumura Hata and COST 231 kernel, with ITU-R P.2109 building entry loss, hexagonal site counts, and planning bounds taken over the models comparable for the chosen deployment rather than a single figure.

Free forever on a Standard account. No credit card.

Overview

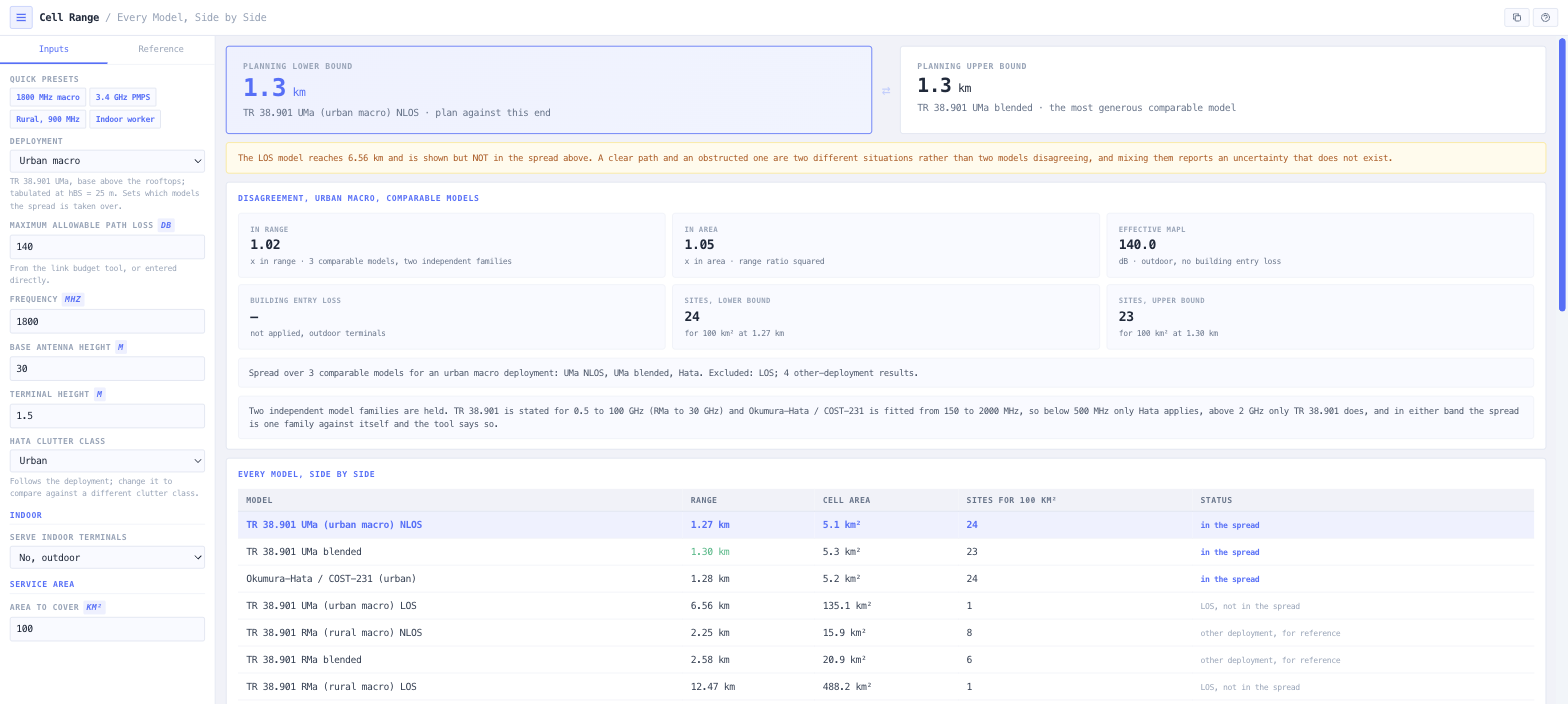
Ten results from one budget. TR 38.901 gives rural macro, urban macro and street canyon models, each in line of sight, non line of sight, and a blend weighted by the line of sight probability from Table 7.4.2-1. Beside them sits the Okumura Hata and COST 231 kernel from the Coverage Predictor, which is validated to nine decimal places against an independent implementation over 193 cases. The table shows all of them, and the planning bounds are taken over the ones that are comparable: the selected deployment's NLOS and blended curves plus Okumura Hata, each inside its stated validity range. Each bound names the model that set it, and the disagreement is reported as a ratio in range and in area.

That disagreement is the output, not a defect in it, and it has to be measured between like and like. Line of sight is a different situation, not a different model. Rural, urban macro and street canyon are different base station geometries, tabulated at 35, 25 and 10 metres, so their disagreement is deployment disagreement: taken over every scenario an 1800 MHz urban macro budget read as a 2.0 times spread, and scoped to urban macro the comparable models agree within a few percent. And a result a model disclaims, because it closed past the distance or outside the frequency the model is stated for, is listed in amber and never sets a bound. A design that survives the planning lower bound is supported by the evidence. One that only works under the most generous model is a decision waiting to be found out.

The TR 38.901 implementation is cross checked against Sionna, NVIDIA's link level simulator, which is an independent implementation of the same specification written by different people. Agreement is within a millionth of a decibel across 456 cases covering all three scenarios, both visibilities and four frequency bands. That check found a real defect in the branch condition, and it is worth saying that the oracle turned out to be wrong first: the version originally used had a bug that made its own path loss wrong by 4.1 dB, and what settled it was evaluating the specification table by hand.

Where a model cannot close the budget inside its own validity range it reports no distance rather than extrapolating, and where the geometry falls outside the applicability ranges the specification states, it says which one and by how much. Indoor terminals go through ITU-R P.2109 building entry loss first, with building class and percentile as inputs, because a thermally efficient building at the ninety fifth percentile is a different problem from a traditional one at the median. Site counts use hexagonal packing: a cell tiles 2.598 r squared, not pi r squared, and using the circle overstates usable area by about a fifth and undercounts sites, which is the optimistic direction and the wrong one to be wrong in.

Capabilities

Ten models from one budget

TR 38.901 RMa, UMa and UMi each in LOS, NLOS and LOS probability blended, plus the Okumura Hata and COST 231 kernel. All solved from the same maximum allowable path loss and all listed; the ones comparable for the chosen deployment set the bounds.

Planning bounds that name their model

The lower and upper bound are the ends of the comparable set for the chosen deployment, and each says which model set it. They are not universal bounds and the page does not present them as such.

The disagreement reported as a ratio

In range and in area, over comparable models only. The spread is the honest headline: a single figure from one model implies a precision that the model set does not support, and a spread that mixes deployments or disclaimed results reports an uncertainty that does not exist.

A disclaimed result never sets a bound

A model that closed the budget past the distance, or outside the frequency or heights, it is stated for has produced a number it disclaims. The number is listed in amber with the reason, exported with the same flag, and excluded from the bounds.

MAPL sensitivity in sites

The bounds and the site count at 3 and 6 dB either side of the budget, each row naming the model behind it, because MAPL is the one input a design actually trades and sites are what it costs.

TR 38.901 cross checked against an independent implementation

Agreement with Sionna within 1e-6 dB across 456 cases spanning all three scenarios, both visibilities and four bands. Written by different people from the same specification, which is what makes the check worth anything.

LOS excluded from the spread, deliberately

Line of sight and non line of sight are different physical situations, not competing models of one situation. Mixing them inflates the reported disagreement without saying anything about model uncertainty, so the spread is taken across comparable models only.

Models that cannot close report nothing

Rather than extrapolating past their own validity range. A model that quietly extrapolates produces output indistinguishable from a supported result, which is worse than one that declines.

Applicability violations surfaced per model

Where the geometry falls outside the ranges the specification states, the tool names which range and by how much, instead of returning a number with an unstated caveat.

ITU-R P.2109 building entry loss

With building class and percentile as inputs. A thermally efficient building at the ninety fifth percentile is a different design problem from a traditional one at the median, and a single indoor allowance cannot represent both.

Hexagonal site counts, not circular

A cell tiles 2.598 r squared. Using pi r squared overstates the usable area by about a fifth and undercounts sites, which is optimistic and therefore the wrong direction for a figure that goes into a budget.

Standards & methodology

  • 3GPP TR 38.901 V17.1.0 Table 7.4.1-1, path loss models for RMa, UMa and UMi
  • TR 38.901 Table 7.4.2-1, line of sight probability
  • Okumura-Hata and COST-231, validated to 1e-9 dB over 193 cases
  • ITU-R P.2109, building entry loss
  • TR 38.901 implementation cross checked against Sionna 2.1.0 to within 1e-6 dB over 456 cases
  • Hexagonal packing at 2.598 r squared
  • Release 17

When to use this tool

  • A first pass on how many sites a service area needs, before any terrain work
  • Checking whether a vendor range claim sits at the optimistic end of the comparable models, or outside them
  • Understanding how much the uncertainty actually is at the scoping stage
  • Comparing an indoor served design against an outdoor one at the same budget
  • Showing a client why a single range figure cannot be relied on
  • Seeing what 3 dB of antenna gain, feeder loss or terminal class is worth in sites
  • Carrying the limiting MAPL from the LTE Link Budget calculator straight into a range and site count
  • Bounding a rural macro design where TR 38.901 RMa and Hata open genuinely disagree by a factor of four
  • Recognising that a 3.4 GHz result has no independent cross check, and treating the narrow spread accordingly
  • Sizing a private LTE or NR network for a mine, port, utility or industrial estate before terrain work

Frequently asked questions

Why show ten models instead of picking the best one?

Because there is no best one for this question. TR 38.901 UMa NLOS and Okumura Hata urban are both defensible for the same 1800 MHz macro cell and they disagree, sometimes by a factor approaching two in area. Picking one and quoting it implies a precision the model set does not support. Showing the spread lets you see whether a design survives the pessimistic end or only works under the generous one.

Why is the spread scoped to one deployment?

Because TR 38.901 RMa, UMa and UMi are fitted to different base station geometries, tabulated at 35, 25 and 10 metres, and comparing them for one cell reports deployment disagreement as model disagreement. On an 1800 MHz urban macro the spread over every scenario read as 2.0 times; scoped to urban macro, UMa NLOS, UMa blended and Okumura Hata urban agree within a few percent. The other scenarios are still listed for reference, they just do not set a bound.

What happens at 3.4 GHz, or at 400 MHz?

Okumura Hata and COST 231 are fitted from 150 to 2000 MHz and TR 38.901 is stated from 0.5 GHz. Above 2 GHz only TR 38.901 is in range, so the spread is UMa against its own blend and the tool says so instead of reporting agreement. Below 500 MHz only Hata is in range, which is one model and therefore no spread at all; the result is in the table with the reason.

Why is line of sight left out of the spread?

Because LOS and NLOS are different physical situations rather than competing models of one situation. Including LOS inflated the reported disagreement from about 2 times to nearly 10 times, which says nothing about model uncertainty and a great deal about whether there is a building in the way. The spread is taken across comparable models so it measures what it claims to.

How is the TR 38.901 implementation validated?

Against Sionna, NVIDIA's link level simulator, which implements the same specification from a separate reading. Agreement is within 1e-6 dB across 456 cases covering all three scenarios, both visibilities and four bands. The check found a real defect in which distance the breakpoint condition tests. It also, informatively, found that the oracle was wrong first: the version originally used returned the 2D distance from its 3D property, making its own path loss 4.1 dB out.

What happens when a model cannot reach the required path loss, or reaches it outside its range?

If it cannot close it reports no distance. If it closes at a distance, frequency or height it is not stated for, the number is shown in amber with the reason and never sets a planning bound, on the page and in the export. Extrapolating past a validity range produces a number that looks exactly like a supported one, and the point of this tool is that it should not.

Why hexagonal packing rather than circles?

Because cells tile. A hexagon inscribed on a cell of radius r covers 2.598 r squared, not pi r squared. Using the circle overstates the usable area by about a fifth and therefore undercounts the sites needed. That error is optimistic, and a site count is exactly the figure where an optimistic error is most expensive.

Does this account for terrain?

No. These are scenario and measurement fitted models and none of them sees a hill. For a first pass at scoping that is the appropriate level of effort, and the result says so plainly. Once the site positions matter, the Coverage Predictor does terrain, diffraction and clutter properly against real elevation data.

Where does the maximum allowable path loss come from?

From a link budget. The LTE Link Budget calculator produces it with the limiting direction named, and the Network Planner passes it through automatically from a single project record. You can also enter one directly if you already have it from another source.