RF Utilities

SNR Calculator

Receiver SNR, energy per bit to noise density ratio (Eb over N0), carrier to noise plus interference, and link margin for systems integrators. Forward (received power to SNR) and reverse (target SNR to required received power) workflows with full calculation trace and modulation reference.

Overview

Signal to noise ratio is the lever that decides whether a digital link delivers its target throughput. Sufficient SNR and the modem locks at the highest modulation order. Insufficient SNR and it falls back to a lower order modulation that throws away spectral efficiency, or fails to lock at all. Receiver datasheets quote sensitivity at a particular BER and modulation, vendor link budget tools assume Nyquist bandwidth and a coding overhead, and the integrator ends up with three numbers that almost agree. The fastest way to a defensible answer is to compute SNR directly from received power and the actual receiver and interference inputs the integrator has on hand, then check the result against the modulation requirement.

The noIM₃ SNR Calculator is purpose built for that workflow. Forward mode computes SNR, Eb over N0, carrier to noise plus interference, and link margin from received power, post filter noise bandwidth, receiver noise figure or system temperature, implementation loss, and any interference. Reverse mode inverts the relationship and returns the required received power (effective sensitivity) to meet a target SNR or Eb over N0, exactly what integrators need during early link sizing or RFQ preparation. The calculator avoids transistor level details and exposes the inputs an RF engineer already has from the receiver datasheet and the link environment.

Noise inputs respect the standard convention. Either noise figure in dB or system noise temperature in Kelvin, never both, with internal conversion using T equals 290 times (10 to noise figure over 10 minus 1) so users never accidentally double count the same noise contribution. Interference modelling supports a single dominant interferer in dBm, a list of interferers summed linearly in milliwatts, or an interference spectral density in dBm per Hz multiplied by bandwidth. Total noise becomes N plus I and feeds into all downstream metrics. Eb over N0 is derived from an explicit data rate input rather than assumed from Nyquist bandwidth, so the result reflects the actual symbol or bit rate of the link rather than a generic textbook approximation. A modulation reference table shows live margin against BPSK, QPSK, 8 PSK, 16 QAM, 64 QAM, and 256 QAM thresholds at typical BER targets.

Capabilities

Forward and reverse modes

Forward mode computes SNR, Eb over N0, and link margin from received power, noise bandwidth, noise figure or system temperature, implementation loss, and interference. Reverse mode inverts the relationship and returns the required received power (effective sensitivity) needed to meet a target SNR or Eb over N0. Useful for early link sizing during RFQ preparation, modem selection, and receiver sizing trade off discussions.

Noise figure or system temperature input

Toggle between noise figure in dB and system noise temperature in Kelvin. The calculator converts internally using T equals 290 times (10 to noise figure over 10 minus 1), so users never accidentally double count the same noise contribution. Useful when the satellite world quotes K and the commercial world quotes dB and both inputs need to feed the same calculation.

Interference modelling

Three interference input modes. Single dominant interferer in dBm. List of interferers summed linearly in milliwatts (the correct combination rule for incoherent interferers). Interference spectral density in dBm per Hz times noise bandwidth (for broadband interference such as adjacent channel emissions or wideband jamming). Total noise becomes N plus I and feeds into all downstream metrics.

Eb over N0 from explicit data rate

Eb over N0 derived as SNR plus 10 log of (noise bandwidth divided by data rate). Explicit data rate input avoids the textbook assumption that bandwidth equals symbol rate (which is only true for ideal Nyquist filtering at zero excess bandwidth). The result reflects the actual symbol or bit rate of the link rather than a generic approximation.

Modulation reference table

Live margin output against BPSK, QPSK, 8 PSK, 16 QAM, 64 QAM, and 256 QAM thresholds at typical BER targets (10 minus 3, 10 minus 6, 10 minus 9). Pass, marginal, and fail status per modulation order at the current operating SNR. Useful for confirming which modulation orders are reachable with the configured link and for adaptive modulation strategy decisions.

Noise density and thermal floor

Returns thermal noise floor in dBm at the configured bandwidth (minus 174 plus 10 log of bandwidth in Hz plus noise figure), noise spectral density N0 in dBm per Hz, and the equivalent noise temperature in Kelvin. Useful for cross checking receiver datasheet noise density figures against the thermal limit and confirming the receiver is operating at the expected noise level.
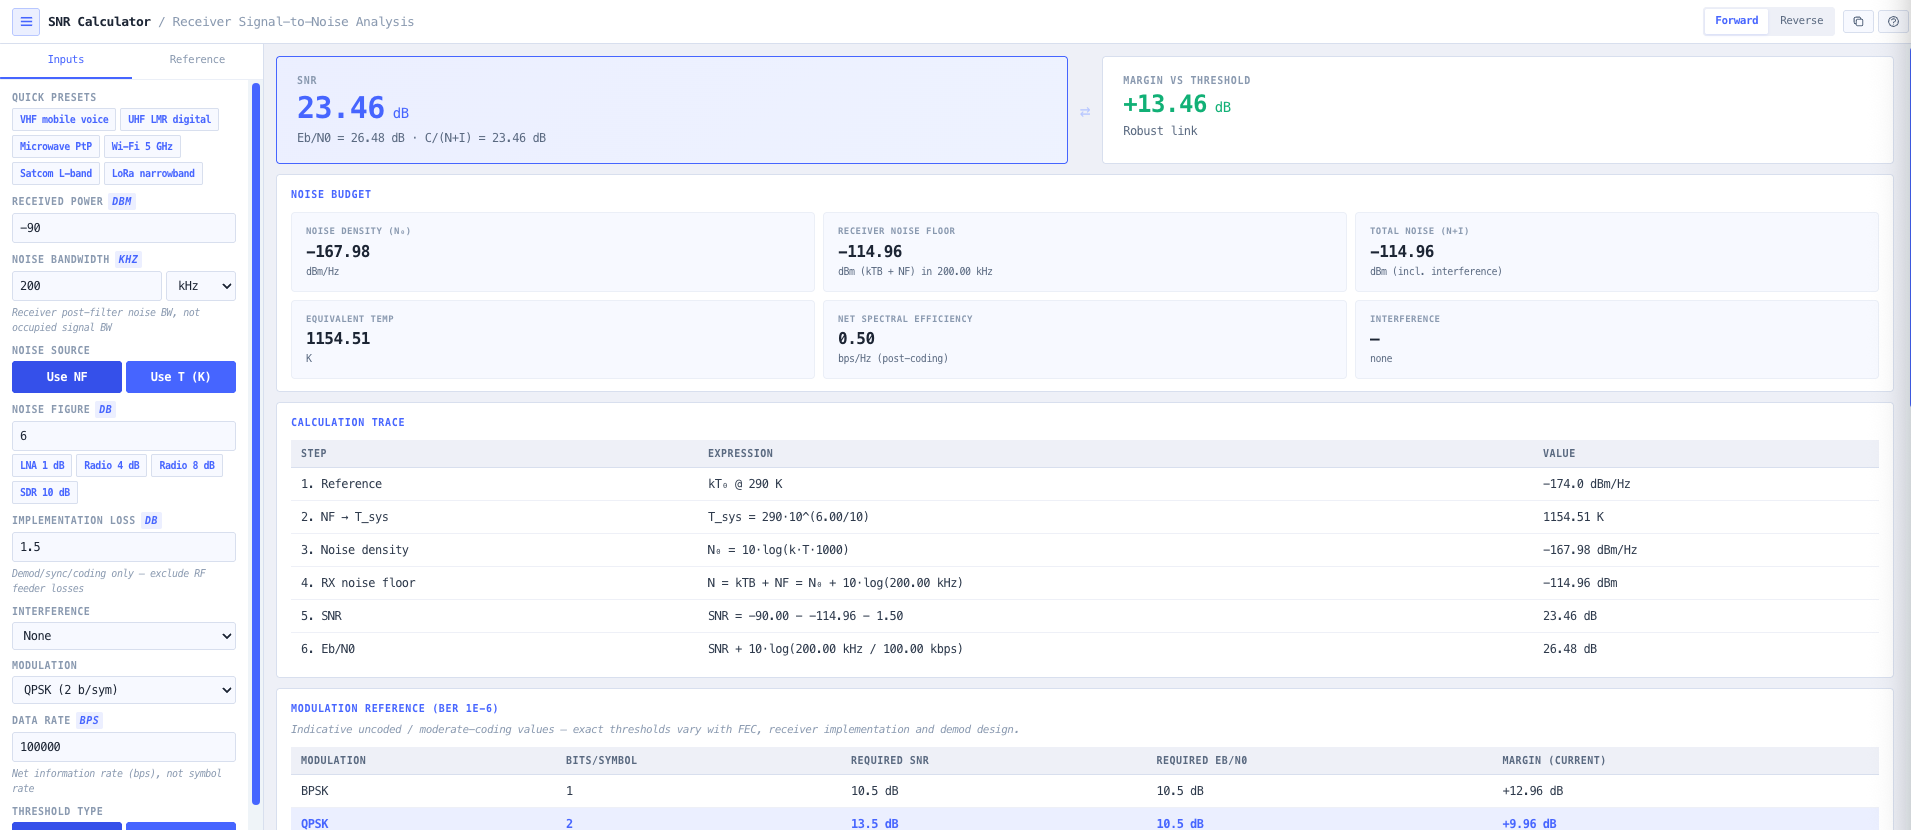
Calculation trace

Step by step trace covering kT0 (the thermal noise reference at minus 174 dBm per Hz), noise figure to temperature conversion, noise density, thermal floor, interference summation, and the final SNR and Eb over N0 derivation. Each step is shown with the formula applied and the intermediate value, so the result is reproducible by another engineer and defensible in a design review.

Margin guidance

Coarse availability verdict (fragile, good urban, high availability, very robust) based on the link margin in dB. Fragile (less than 3 dB margin) means the link will fail under realistic propagation variation. Good urban (3 to 10 dB) is typical for cellular and WiFi. High availability (10 to 20 dB) is typical for microwave backhaul. Very robust (greater than 20 dB) is typical for satellite and high reliability links.

Integrator presets

Built in presets for LMR (land mobile radio), microwave point to point, WiFi 2.4 and 5 GHz, satellite uplink and downlink, and LoRa configurations. Each preset populates noise bandwidth, noise figure, modulation, and data rate for the common scenario so a usable answer is one click away. Manual entry remains available for unusual receivers and custom links.

Browser only computation

Runs entirely in your browser. No received power, noise figure, or link parameter data is submitted to a server. Useful for commercially confidential receiver sizing and link design work, defence and intelligence systems integration, and environments where information security policy prohibits sending engineering data to third party services.

Standards & methodology

  • IEEE definition of Noise Figure with reference temperature 290 K
  • Boltzmann constant 1.380649 e minus 23 J per K (CODATA exact value)
  • Shannon (1948) AWGN channel capacity reference
  • 3GPP TS 38.214 and TS 36.213 minimum SNR thresholds for 5G NR and LTE MCS
  • IEEE 802.11 minimum SNR thresholds for WiFi MCS
  • DVB S2 and DVB T2 minimum carrier to noise thresholds for MODCOD

When to use this tool

  • Sizing a receiver during early link design and RFQ preparation
  • Validating modulation choice against measured received power
  • Estimating effective sensitivity for a target SNR or Eb over N0
  • Quantifying the impact of single or multiple interferers on a link
  • Comparing receiver options by noise figure or system temperature
  • Sanity checking datasheet noise density against the thermal floor
  • Producing engineering evidence for receiver acceptance testing
  • Adaptive modulation strategy decisions for cellular, satellite, or microwave links
  • Confirming that a candidate receiver supports the target modulation under expected conditions
  • Diagnosing why a working link is failing or operating at a lower modulation than expected
  • Producing receiver sensitivity evidence for satellite link acceptance test reports
  • Teaching SNR, Eb over N0, and the relationship between received power, noise, and modulation choice

Is this the right tool for you?

Reach for the SNR Calculator in any of the following situations.

  • You are sizing a receiver for a microwave point to point, satellite, or cellular link and need to confirm SNR, Eb over N0, and link margin against the candidate modulation order before selecting a modem.
  • You have a target SNR or Eb over N0 from the modem datasheet and need to compute the required received power (effective sensitivity) so the link budget can be sized correctly.
  • You are evaluating the impact of an interferer (or several) on a working receiver and need to recompute SNR with N plus I rather than thermal noise alone.
  • You are choosing between two candidate receivers with different noise figures and want a like for like SNR comparison at the same operating bandwidth and received power.
  • You are reading a satellite LNA datasheet that quotes noise temperature in Kelvin and need to drop it into a calculation against a receiver noise bandwidth in MHz without converting to dB by hand.
  • You are diagnosing a working link that is operating at a lower modulation than expected and need to identify whether the bottleneck is noise, interference, or implementation loss.
  • You are validating that a candidate receiver supports 256 QAM under the expected received power and noise environment, and want a clear pass or fail against the modulation threshold.
  • You are training new RF systems integrators in receiver sizing and want a teaching tool that exposes the relationship between received power, noise, interference, and modulation choice.
  • You are producing receiver sensitivity evidence for a satellite link acceptance test report and need a defensible SNR and Eb over N0 calculation alongside the calculation trace.
  • You are designing an adaptive modulation strategy for a cellular, satellite, or microwave link and need to identify the SNR breakpoints between modulation orders.
  • You are sanity checking a vendor receiver noise density figure against the thermal floor at the operating bandwidth and noise figure to confirm the datasheet claim is realistic.
  • You are sizing an LMR (land mobile radio) receiver against an in band interferer and need a quick interferer plus thermal noise SNR calculation.
  • You are sizing a LoRa or IoT receiver against a low data rate and want Eb over N0 derived from the actual bit rate rather than assumed Nyquist bandwidth.
  • You are integrating a satellite link where the noise environment is dominated by antenna and sky temperature rather than receiver noise figure, and need the system temperature input form.
  • You are operating under a security regime that prohibits sending receiver design data to third party services and need an SNR calculator that runs entirely in your browser.

Frequently asked questions

How is SNR calculated?

SNR in dB equals received power in dBm minus noise floor in dBm minus implementation loss in dB. Noise floor in dBm equals minus 174 plus 10 log of noise bandwidth in Hz plus noise figure in dB (the standard kTB plus NF relationship). With interference, total noise becomes N plus I where I is the interference power summed linearly in milliwatts before conversion to dBm. The calculator surfaces every step of the calculation in the trace so the result is reproducible.

What is the difference between SNR and Eb over N0?

SNR is the ratio of carrier power to total noise power across the noise bandwidth. Eb over N0 is the ratio of energy per bit to noise spectral density. The two are related by Eb over N0 in dB equals SNR plus 10 log of (noise bandwidth divided by data rate). For a Nyquist filtered signal with bandwidth equal to symbol rate and a single bit per symbol, they are equal. For higher order modulation or non Nyquist filtering, they differ. The calculator computes both from explicit data rate input rather than assuming a relationship.

Should I use noise figure or system temperature?

Use whichever your datasheet provides. They describe the same physical thing in different vocabularies. Commercial receivers typically quote noise figure in dB. Cryogenic and satellite low noise amplifiers typically quote system temperature in Kelvin. The calculator converts internally using T equals 290 times (10 to noise figure over 10 minus 1), and toggling between the two never double counts because only one form is active at a time.

How is interference handled?

Three modes. Single dominant interferer in dBm (typical of an in band emitter at a known level). List of interferers summed linearly in milliwatts before conversion back to dBm (the correct combination rule for incoherent interferers). Interference spectral density in dBm per Hz times noise bandwidth (for broadband interference such as adjacent channel emissions or wideband jamming). Total noise becomes N plus I and replaces N in all downstream metrics including SNR and link margin.

Why does explicit data rate matter for Eb over N0?

Textbook derivations of Eb over N0 typically assume noise bandwidth equals symbol rate and one bit per symbol, which is true only for ideal Nyquist filtered BPSK. Real systems have excess bandwidth (typically 0.2 to 0.35 alpha for raised cosine filters), higher order modulation (multiple bits per symbol), and forward error correction (more channel symbols than information bits). Explicit data rate input lets the calculator compute Eb over N0 from the actual information bit rate rather than a generic textbook approximation.

How is link margin classified?

Coarse availability verdict based on the dB margin against the chosen modulation threshold. Fragile (less than 3 dB) means the link will fail under realistic propagation variation. Good urban (3 to 10 dB) is typical for cellular and WiFi. High availability (10 to 20 dB) is typical for microwave backhaul. Very robust (greater than 20 dB) is typical for satellite and high reliability links. The verdict supports fast feasibility decisions during early sizing.

How does this support link budget work?

SNR is the headline output of the link budget. Use the noIM₃ Link Budget Calculator for the full link including propagation losses (FSPL, rain, atmospheric absorption, foliage, polarisation), and use the SNR Calculator to evaluate the resulting SNR, Eb over N0, and modulation feasibility at the receiver. Reverse mode in the SNR Calculator returns the required received power that feeds back into the link budget as the sensitivity threshold.

Does any data leave my browser?

No. The calculator runs entirely in your browser. No received power, noise figure, or link parameter data is submitted to a server. Useful for commercially confidential receiver sizing and link design work, defence and intelligence systems integration, and environments where information security policy prohibits sending engineering data to third party services.