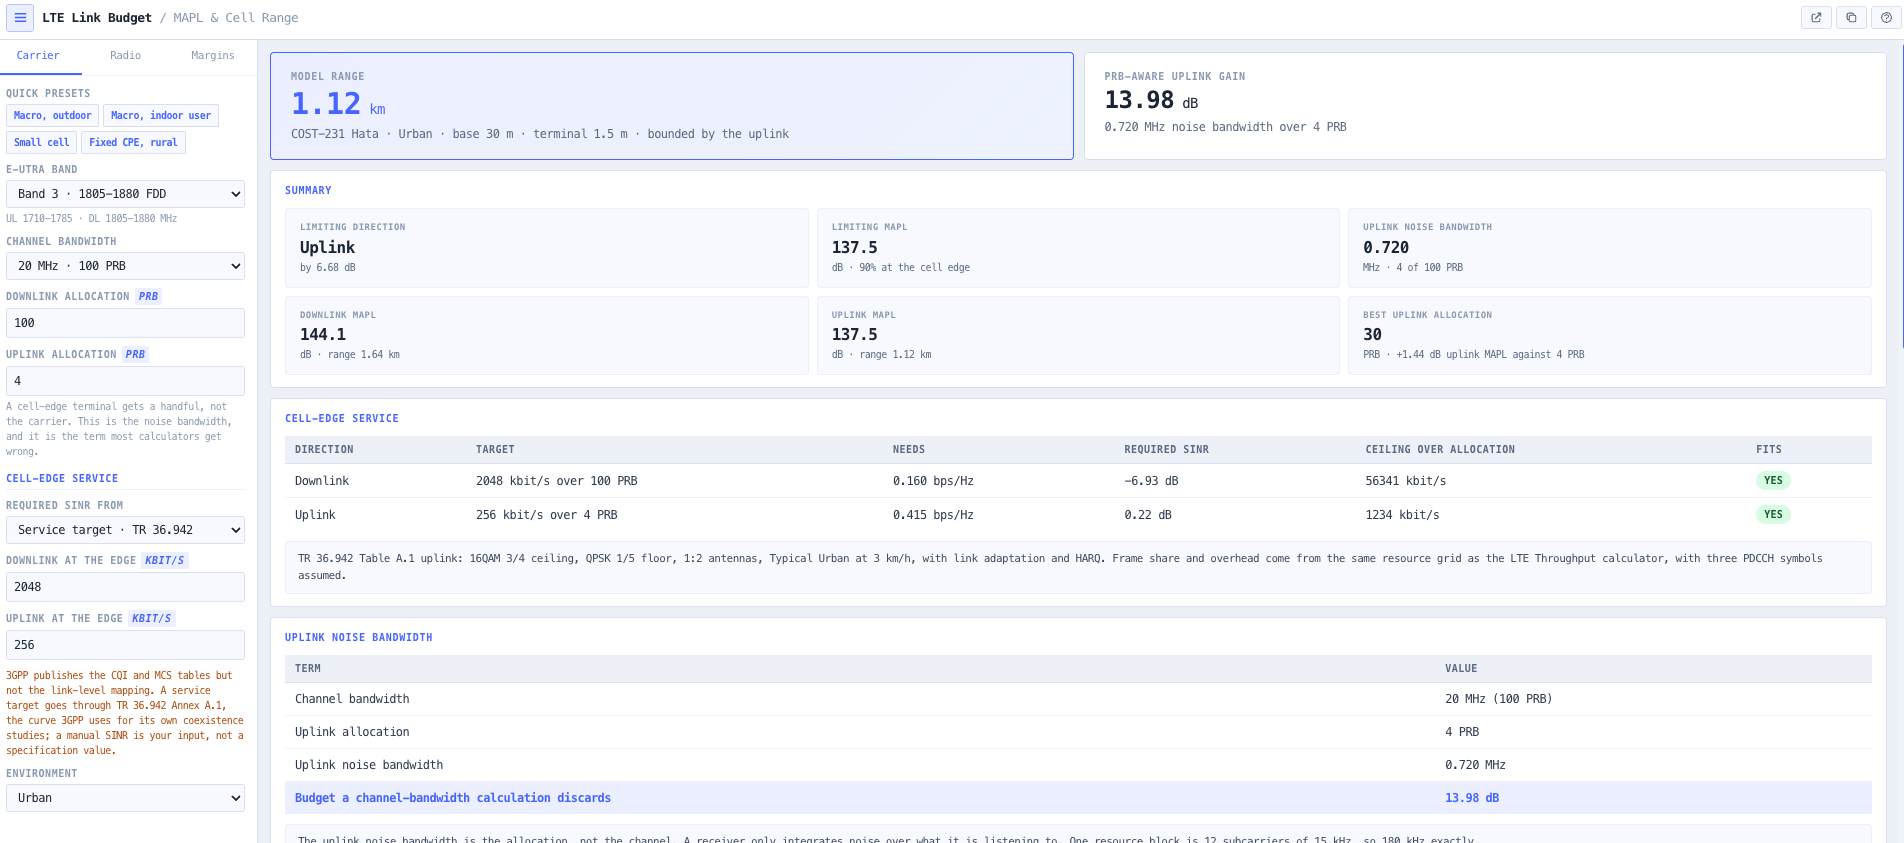
What is wrong with using the channel bandwidth for uplink noise?
A receiver integrates noise over what it is listening to. A cell edge terminal is scheduled a handful of resource blocks at 180 kHz each, not the whole carrier. Using the channel bandwidth overstates the uplink noise floor by 10 log10 of the ratio, which on a 20 MHz carrier with four resource blocks is 14 dB. The error is pessimistic, so it rarely gets challenged, and it is used to justify sites the network does not need.
Is the uplink not always the limiting direction?
No, and that is one of the most useful things this tool surfaces. At a wide uplink allocation the uplink limits, because the terminal has a fraction of the base station power. Narrow the allocation and the uplink noise bandwidth falls with it, and somewhere in the single digits or tens of resource blocks the downlink takes over. The tool prints the allocation at which that happens. A calculator that assumes the uplink always binds will recommend more terminal power for a problem that is at the other end of the link.
How does a service target become a required SINR?
3GPP publishes the CQI and MCS tables but not the link level mapping from SINR to either, so any table that says a given MCS needs a given SINR is an invention. What 3GPP does publish, for exactly this purpose, is the attenuated Shannon bound of TR 36.942 Annex A.1 with its fitted parameters. The tool takes the kbit/s over the allocation, applies the frame share and overhead of the actual resource grid, and inverts that curve. The result is labelled derived with the clause, the curve's basis (1:2 antennas, Typical Urban channel) is printed under Sources, and if you have a measured vendor figure the manual SINR mode takes it instead.
What does 90 per cent at the cell edge mean, and where does the sigma come from?
Shadow fading is log normal around the median path loss, so a median budget serves half the locations at the edge. The margin that serves 90 per cent is sigma times 1.28, and 95 per cent is sigma times 1.64. Sigma comes from ITU-R P.1546-6 Annex 5 section 12 by service area, 8 dB urban, 10 dB suburban and 12 dB open, or you can type your own. The term in the budget shows the arithmetic and the limiting MAPL says which probability it carries. It is an edge probability; the area probability is higher.
Per port or total: why does the tool ask?
Because equipment datasheets are written both ways, 2 x 20 W and 40 W both appear, and reading one as the other is a 3 dB error on two ports and 6 dB on four. Three dB of downlink budget is roughly a fifth of the range. The Ports combined line adds 10 log of the ports for per port power, adds nothing for total, and says which it did.
Why does the derived sensitivity not match TS 36.101 exactly?
Because they are different quantities, and the page says so. Table 7.3.1-1 is a conformance minimum measured at a defined reference measurement channel, with implementation margin built into it. The derived figure is kTB plus a noise figure plus the SINR you asked for. They land close for good reasons, but exact agreement would be a coincidence rather than a validation, and treating it as one would be misleading.
Which parts of the budget are assumptions?
They are labelled on the line. The receive diversity combining gain depends on branch correlation, which depends on the installation. A UE power class the band does not define is budgeted at 23 dBm and flagged. When a service target is converted to an SINR, three PDCCH symbols are assumed for the overhead and the curve is a generic 3GPP one rather than this vendor's equipment. Everything else is either a specification value with its clause, one of your inputs, or derived from the others.
Why does it sometimes refuse to report a range?
Because the frequency or an antenna height is outside the domain Hata and COST 231 were fitted over, 150 to 2000 MHz and a base antenna of 30 to 200 m, or because the budget does not close anywhere from 20 m to 100 km. Extrapolating past that produces a number that looks exactly like a valid one, with nothing to indicate it is unsupported. Declining is the honest output, the tool says which bound was crossed, and the Cell Range tool takes the same MAPL to the TR 38.901 models that do cover 3.5 GHz and small cells.
What does the Cell Range hand-off carry, and what does it leave out?
The limiting MAPL, the frequency of the direction that produced it, both antenna heights and the clutter class. It turns Cell Range's indoor option off, because the budget already contains whatever building entry loss you put in it and applying P.2109 on top would count it twice; the notice on the far side says how many dB were already inside the MAPL. Cell Range then picks the TR 38.901 deployment from the clutter class and base height, and you can change it.
How is the range model validated?
The Okumura Hata and COST 231 kernel is shared with the Coverage Predictor and agrees with an independent third party implementation to nine decimal places across 193 cases. It is the same kernel, not a second copy, which matters: a duplicated propagation model that drifts from the validated one is worse than not having the feature.
Does this account for terrain?
No. The range comes from a measurement fitted clutter model, and nothing in it sees a hill. For a first pass on cell count that is the right level of effort, and for anything past scoping the Coverage Predictor does the terrain work properly. The result says so rather than leaving it to be assumed.