

Digital Signal Processing

Error Vector Magnitude Calculator

EVM from SNR or a full hardware error budget, with standards compliance against 5G NR, LTE, WiFi 6, and DOCSIS 3.1. Decompose EVM into phase noise, IQ amplitude and phase imbalance, LO leakage, and nonlinearity contributions in one workspace.

Free ● Live 6 standards

Free to use, no sign-up needed.

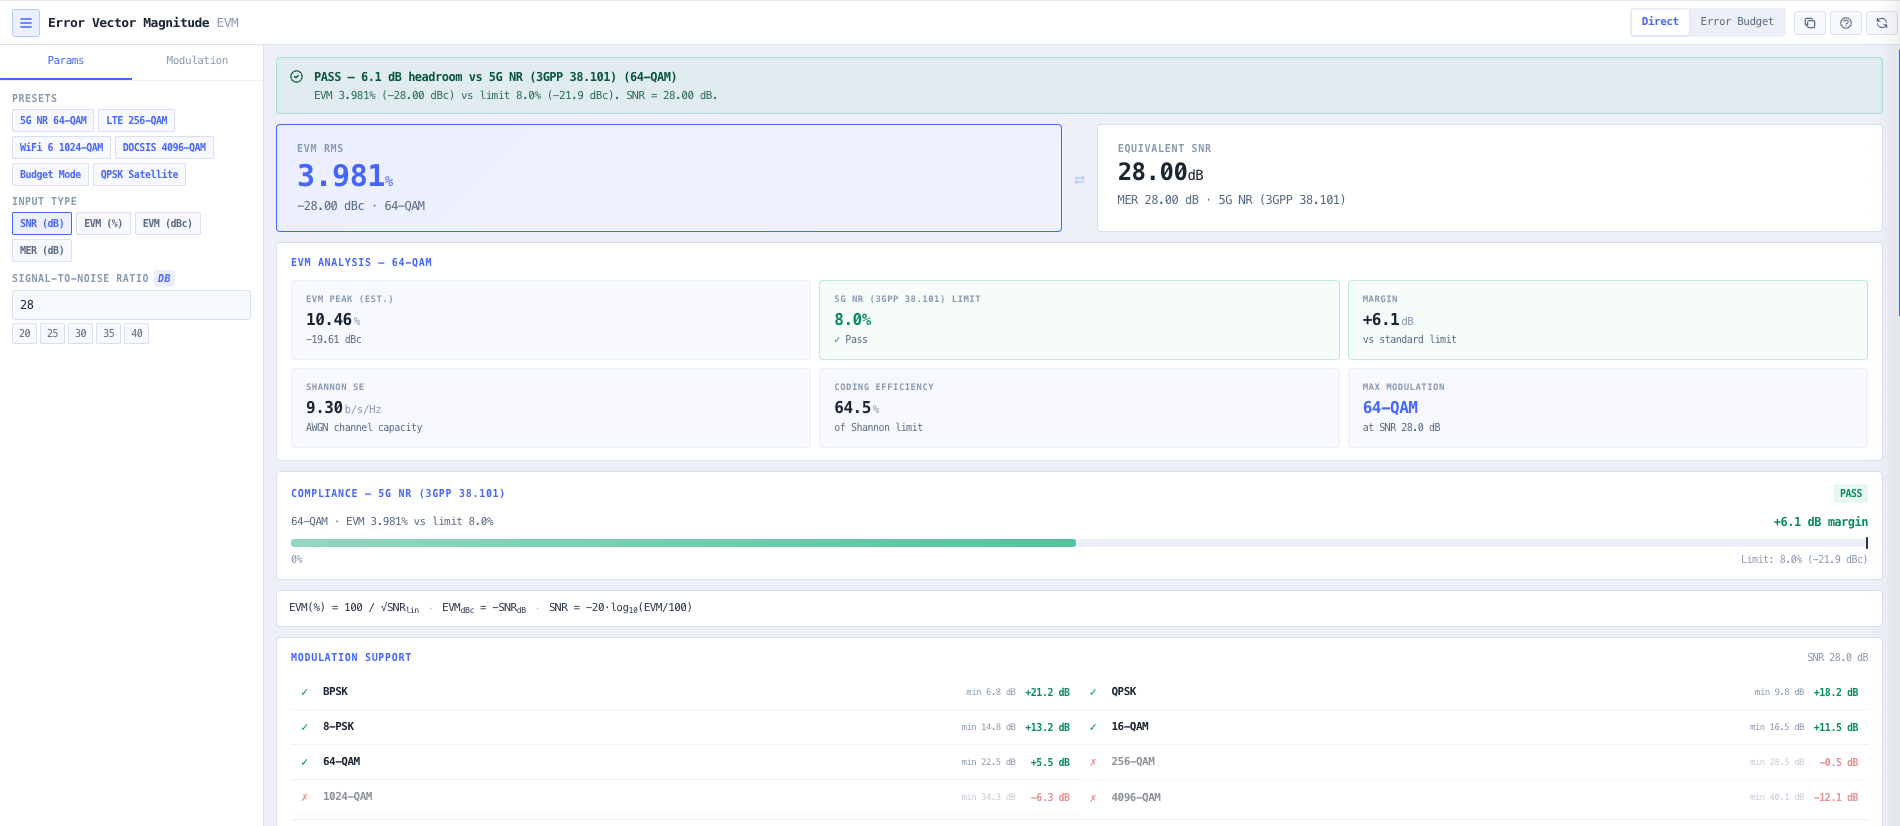
Six standard presets (5G NR 64-QAM, LTE 256-QAM, WiFi 6 1024-QAM, DOCSIS 4096-QAM, Budget Mode, QPSK Satellite).

Walkthrough

See it working

Six standard presets (5G NR 64-QAM, LTE 256-QAM, WiFi 6 1024-QAM, DOCSIS 4096-QAM, Budget Mode, QPSK Satellite).
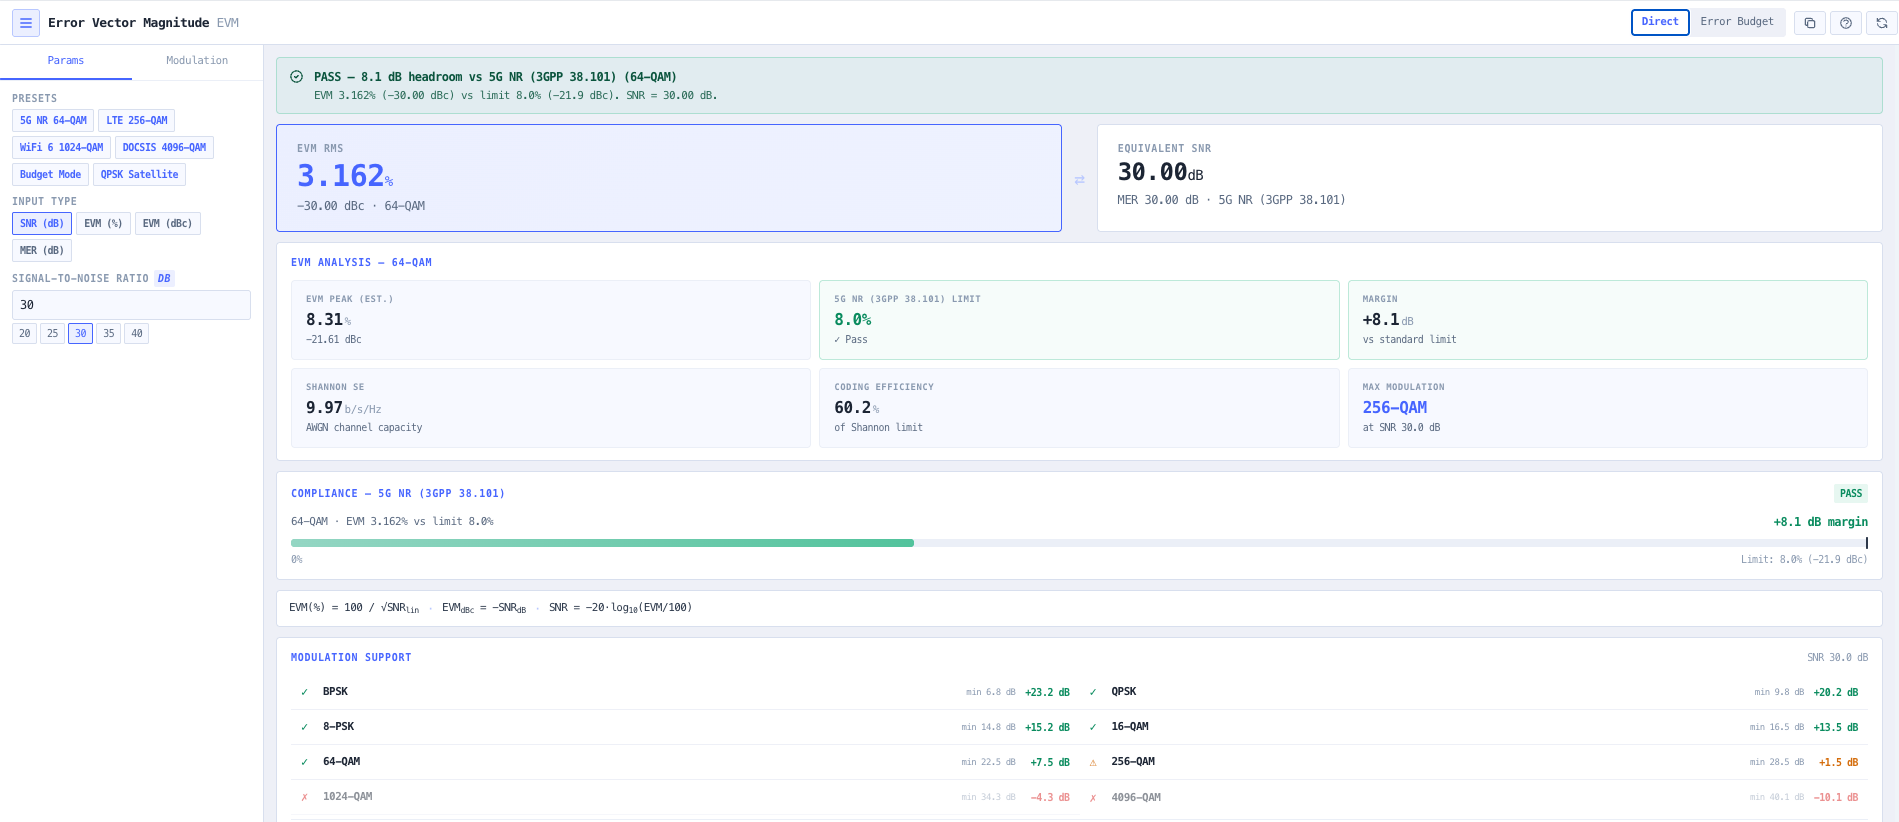
Direct mode with live conversion across SNR, EVM percent, EVM dBc, and MER, plus the peak EVM bound.
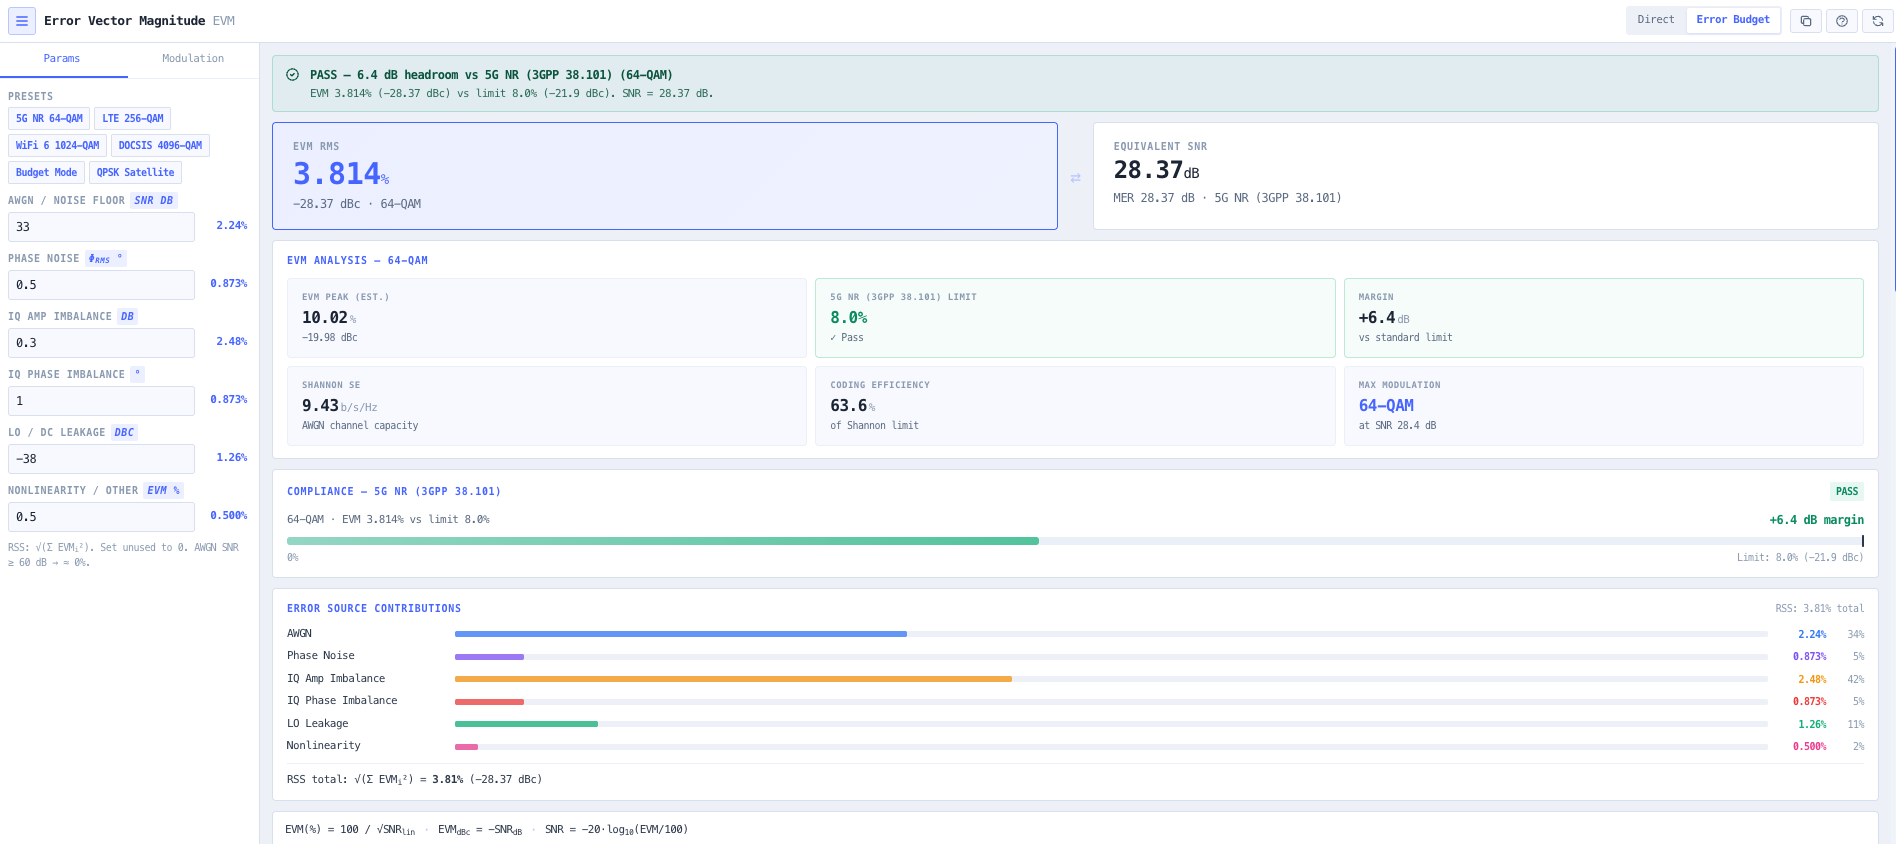
Error Budget with six impairment sources (AWGN, Phase Noise, IQ Amp, IQ Phase, LO Leakage, Nonlinearity) combined via RSS.
Standards compliance banner with margin in dB and a warning when less than 3 dB above the limit.

Six standard presets (5G NR 64-QAM, LTE 256-QAM, WiFi 6 1024-QAM, DOCSIS 4096-QAM, Budget Mode, QPSK Satellite).

Overview

What the Error Vector Magnitude Calculator does

Error Vector Magnitude (EVM) is the figure of merit that decides whether a digital transmitter actually meets the standard it claims to meet. Every 3GPP, IEEE, and CableLabs specification sets explicit EVM limits per modulation order, and the trend in modern wireless is for those limits to tighten as new MCS modes (1024 QAM in 5G NR FR1, 4096 QAM in WiFi 7, 4096 QAM in DOCSIS 3.1) demand cleaner transmit signals. Get the EVM right and the radio passes type approval and operates at peak throughput. Miss the limit and the radio will not pass certification, will not interoperate cleanly, and will fall back to lower order modulations that throw away spectral efficiency.

Read the full overview

The noIM₃ Error Vector Magnitude Calculator gives you both ends of the EVM problem in one workspace. Direct mode accepts a single SNR or EVM value (in percent, dBc, or MER in dB) and converts instantly across all representations. EVM rms equals 100 divided by square root of SNR linear, expressed as a percentage. EVM in dBc equals minus SNR in dB. SNR in dB equals minus 20 log of (EVM rms divided by 100). Peak EVM is reported as a Rayleigh statistical estimate (EVM peak approximately EVM rms times square root of ln N), which gives roughly plus 8.4 dB above RMS for typical N around 1000 symbols.

Error budget mode decomposes EVM into the individual hardware impairments engineers actually have to allocate during transmitter and receiver design. AWGN noise floor through SNR. Integrated phase noise (EVM equals sin of phi rms times 100 per cent). IQ amplitude imbalance G in dB. IQ phase imbalance theta in degrees. LO and DC leakage L in dBc. Nonlinearity entered directly. Total EVM combines via root sum of squares assuming uncorrelated sources, with bar charts showing the relative contribution of each. Compliance against 5G NR, LTE, WiFi 6, and DOCSIS 3.1 is assessed in real time with margin reported in dB. A live constellation diagram renders ideal symbol points alongside a Gaussian scatter cloud scaled to the current EVM, giving a clear visual sense of symbol separability for the selected modulation.

Capabilities 9

EVM and SNR conversion (Direct mode)

Enter SNR in dB, EVM in percent, EVM in dBc, or MER in dB. The calculator converts instantly across all representations using the exact AWGN relationship. EVM rms equals 100 divided by square root of SNR linear, expressed as percentage. EVM in dBc equals minus SNR in dB. Peak EVM is reported as a Rayleigh statistical estimate (EVM peak approximately EVM rms times square root of ln N), giving plus 8.4 dB above RMS for typical N.

Six source error budget

Decompose EVM into individual hardware impairments. AWGN through SNR. Integrated phase noise phi rms in degrees with EVM equals sin of (phi rms times pi over 180) times 100 per cent. IQ amplitude imbalance G in dB with EVM equals magnitude of (10 to the G over 20) minus 1 divided by square root of 2 times 100 per cent. IQ phase imbalance theta in degrees with EVM equals magnitude of sin of (theta over 2 times pi over 180) times 100 per cent. LO and DC leakage L in dBc with EVM equals 10 to the L over 20 times 100 per cent. Nonlinearity entered directly.

Root sum of squares budget combination

Total EVM equals square root of the sum of squared contributions, assuming the error sources are uncorrelated. Bar charts show the relative power contribution of each source so design effort targets the dominant impairment rather than the cosmetic one. Useful for transmitter and receiver design where the budget for each impairment must be allocated against an aggregate compliance target.

5G NR, LTE, WiFi 6, and DOCSIS 3.1 compliance

5G NR limits per 3GPP TS 38.101 to 1 Table 6.5.2.1 to 1 (UE Tx EVM). LTE limits per 3GPP TS 36.101 Table 6.5.2.1 to 1. WiFi 6 limits per IEEE 802.11ax to 2021 Table 27 to 43 (EVM in dBr converted to per cent). DOCSIS 3.1 limits per CableLabs PHY specification covering QPSK through 4096 QAM. Compliance margin reported in dB. Less than 3 dB triggers a warning so designs with no headroom are flagged before certification.

Modulation support grid

Checks all eight common modulation orders (BPSK, QPSK, 8 PSK, 16 QAM, 64 QAM, 256 QAM, 1024 QAM, 4096 QAM) against the minimum SNR required for BER less than or equal to 10 to the minus 3, reporting pass (3 dB or more margin), marginal (0 to 3 dB), or fail. Useful for adaptive modulation strategy decisions and for confirming which modulation orders are reachable with the current EVM budget.

Live constellation diagram

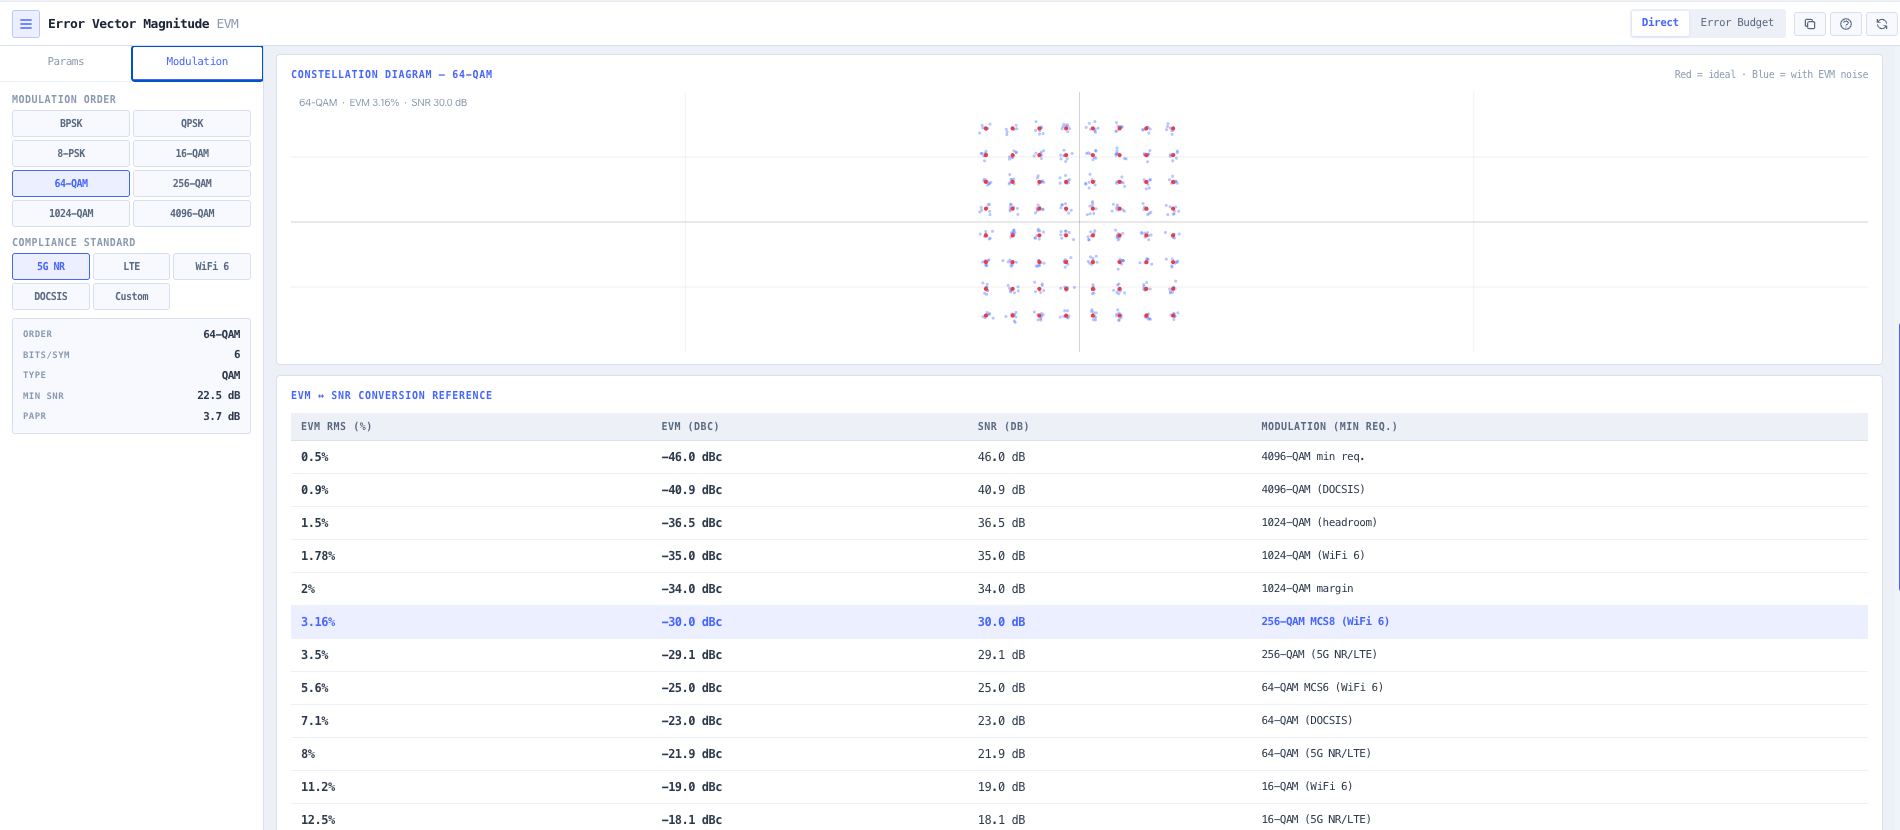
Renders ideal symbol points (in red) alongside a Gaussian scatter cloud (in blue) scaled by the current EVM for the selected modulation order. Provides immediate visual sense of symbol separability and how rapidly higher order constellations (256 QAM, 1024 QAM, 4096 QAM) collapse into ambiguity as EVM increases. Useful for design reviews and explaining EVM to non specialist stakeholders.

Standards EVM limits matrix and reference tables

Built in matrix showing EVM limits per modulation order for each supported standard. EVM versus SNR conversion reference table for fast cross check. Modulation properties reference covering bits per symbol, minimum SNR for target BER, and Shannon spectral efficiency. Suitable for inclusion in engineering documentation and standards compliance evidence.

Presets and copy to clipboard

Built in presets for 5G NR UE Tx, LTE UE Tx, WiFi 6 access point Tx, DOCSIS 3.1 cable modem, and budget mode for transmitter design from scratch. Copy results to clipboard for inclusion in engineering reports. Standards compliance verdict includes the reference clause for traceability.

Browser only computation

Runs entirely in your browser. No EVM values, error budget contributions, or design data is submitted to a server. Useful for commercially confidential transmitter design work, defence and intelligence radio development, and environments where information security policy prohibits sending engineering data to third party services.

Inputs and outputs

What goes in, what comes out

Inputs 9

  • Direct mode: SNR in dB, EVM in per cent, EVM in dBc, or MER in dB
  • Phase noise integrated phi rms in degrees
  • IQ amplitude imbalance G in dB
  • IQ phase imbalance theta in degrees
  • LO and DC leakage L in dBc
  • Nonlinearity contribution as EVM per cent
  • Modulation order (BPSK, QPSK, 8 PSK, 16 QAM, 64 QAM, 256 QAM, 1024 QAM, 4096 QAM)
  • Target standard (5G NR, LTE, WiFi 6, DOCSIS 3.1)
  • Optional preset (5G NR UE Tx, LTE UE Tx, WiFi 6 AP Tx, DOCSIS 3.1, budget design)

Outputs 11

  • EVM rms in per cent and dBc
  • EVM peak in per cent and dBc (Rayleigh statistical estimate)
  • SNR in dB and MER in dB
  • Per source EVM contribution and percentage of total power
  • RSS combined EVM total
  • Compliance pass or fail and margin in dB against 5G NR, LTE, WiFi 6, and DOCSIS 3.1
  • Modulation support grid (pass, marginal, fail) for BPSK to 4096 QAM
  • Shannon spectral efficiency and coding efficiency relative to AWGN capacity
  • Live constellation diagram with ideal points and EVM scaled scatter cloud
  • Standards EVM limits matrix per modulation order
  • Reference EVM versus SNR conversion table

Standards & methodology

  • 3GPP TS 38.101 to 1. 5G NR User Equipment radio transmission and reception
  • 3GPP TS 38.104. 5G NR Base Station radio transmission and reception
  • 3GPP TS 36.101. LTE User Equipment radio transmission and reception
  • IEEE 802.11ax to 2021. WiFi 6 PHY specification
  • CableLabs DOCSIS 3.1 PHY specification (CM SP PHYv3.1)
  • Shannon (1948) AWGN channel capacity reference

Use cases

When to use this tool

  1. 01Transmitter EVM characterisation before over the air type approval testing
  2. 02Receiver sensitivity analysis to determine required SNR for target modulation
  3. 03IQ impairment budgeting across phase noise, amplitude balance, and LO leakage
  4. 04Link budget closure to determine maximum tolerable EVM for a given path loss
  5. 055G NR and LTE radio frequency front end qualification against 3GPP Tx EVM masks
  6. 06WiFi 6 access point design (1024 QAM MCS 11 requires EVM less than or equal to 1.78 per cent)
  7. 07DOCSIS 3.1 cable system commissioning (4096 QAM requires EVM less than or equal to 0.9 per cent)
  8. 08Phase noise specification allocation across local oscillator and synthesiser blocks
  9. 09IQ imbalance correction algorithm validation against allowed residual budget
  10. 10Producing EVM compliance evidence for radio type approval submissions
  11. 11Sanity checking vendor radio EVM claims against the underlying hardware budget
  12. 12Teaching modulation quality, EVM, and constellation distortion fundamentals

FAQ

Frequently asked questions

Not here? Ask us

What is EVM and why does it matter?

Error Vector Magnitude is the difference between the ideal symbol position in the constellation and the actually measured symbol position, expressed as a fraction of the ideal symbol amplitude. It is the standard figure of merit for digital transmitter and receiver quality because it captures all the impairments that move symbols away from their ideal positions in a single number. Every 3GPP, IEEE, and CableLabs specification sets explicit EVM limits per modulation order, and meeting those limits is required for type approval.

How is EVM related to SNR?

For an AWGN limited channel, EVM rms equals 100 divided by square root of SNR linear, expressed as percentage. EVM in dBc equals minus SNR in dB. So a 30 dB SNR gives an EVM of 3.16 per cent. A 40 dB SNR gives 1 per cent. A 50 dB SNR gives 0.316 per cent. The conversion is exact for the AWGN case but real transmitters see additional impairments (phase noise, IQ imbalance, nonlinearity) that need to be combined via root sum of squares for the realistic answer.

How is the error budget combined?

Total EVM equals square root of the sum of squared contributions, assuming the error sources are uncorrelated. This is the right combination rule for independent random impairments (AWGN noise, integrated phase noise, IQ amplitude imbalance, IQ phase imbalance, LO leakage, nonlinearity). The calculator surfaces the relative contribution of each source as a percentage of total power so the dominant impairment is visible.

What is peak EVM versus RMS EVM?

RMS EVM is the time averaged value across many symbols. Peak EVM is the largest single symbol error, which exceeds RMS by a statistical factor. Because the error vector is Rayleigh distributed, the level exceeded roughly once per N symbols is EVM peak approximately EVM rms times square root of (ln N), where N is the number of symbols. For typical N around 1000, this is roughly plus 8.4 dB above RMS. The calculator reports peak EVM as an estimate alongside the RMS value; the standards compliance check is performed against the RMS limit.

How are phase noise and IQ imbalance translated to EVM?

Phase noise (integrated rms) phi rms in degrees gives EVM equals sin of (phi rms times pi over 180) times 100 per cent. IQ amplitude imbalance G in dB gives EVM equals magnitude of (10 to the G over 20) minus 1 divided by square root of 2 times 100 per cent. IQ phase imbalance theta in degrees gives EVM equals magnitude of sin of (theta over 2 times pi over 180) times 100 per cent. These are the standard small angle approximations used across the radio design industry.

Which standards are checked?

5G NR per 3GPP TS 38.101 to 1 Table 6.5.2.1 to 1. LTE per 3GPP TS 36.101 Table 6.5.2.1 to 1. WiFi 6 per IEEE 802.11ax to 2021 Table 27 to 43 (with EVM in dBr automatically converted to per cent). DOCSIS 3.1 per CableLabs CM SP PHYv3.1 covering QPSK through 4096 QAM. Compliance margin in dB is reported alongside pass or fail. Less than 3 dB triggers a warning so marginal designs are flagged before certification.

How does this relate to the Constellation Diagram Analyser and FFT Spectrum Analyser?

The EVM Calculator quantifies the modulation quality with a single figure of merit and decomposes it into hardware impairments. The Constellation Diagram Analyser and FFT Spectrum Analyser provide the visual and spectral views that show what those impairments look like in time and frequency domain. Use the EVM Calculator for budget allocation and standards compliance. Use the Constellation Diagram Analyser to visualise the impact. Use the FFT Spectrum Analyser to confirm the spectral signature.

Does any data leave my browser?

No. The calculator runs entirely in your browser. No EVM values, error budget contributions, or design data is submitted to a server. Useful for commercially confidential transmitter design work, defence and intelligence radio development, and environments where information security policy prohibits sending engineering data to third party services.

Free, no sign-up

Free to use, no sign-up needed.