Digital Signal Processing

Modulation and Throughput Calculator

BER, spectral efficiency, Shannon capacity, and standards based MCS throughput in one workspace. Compare BPSK, QPSK, PSK, QAM up to 4096 QAM, and FSK families against the Shannon limit, and compute peak throughput for LTE, 5G NR, WiFi 6 and 7, DVB T2 and S2, TETRA, DMR, and P25.

Overview

Digital modulation choice is the lever that converts a noise limited link into a working data circuit. Pick the wrong scheme and you either give up usable throughput by under modulating, or you fail the bit error rate target by over modulating against an SNR that cannot support it. Modern digital standards (LTE, 5G NR, WiFi 6 and 7, DVB T2 and S2) handle this dynamically through Modulation and Coding Scheme (MCS) selection, but the underlying physics still has to be understood. Spectral efficiency, BER versus SNR, the Shannon Hartley bound, and the gap between practical schemes and the Shannon limit are the four numbers that set the achievable performance for any digital link.

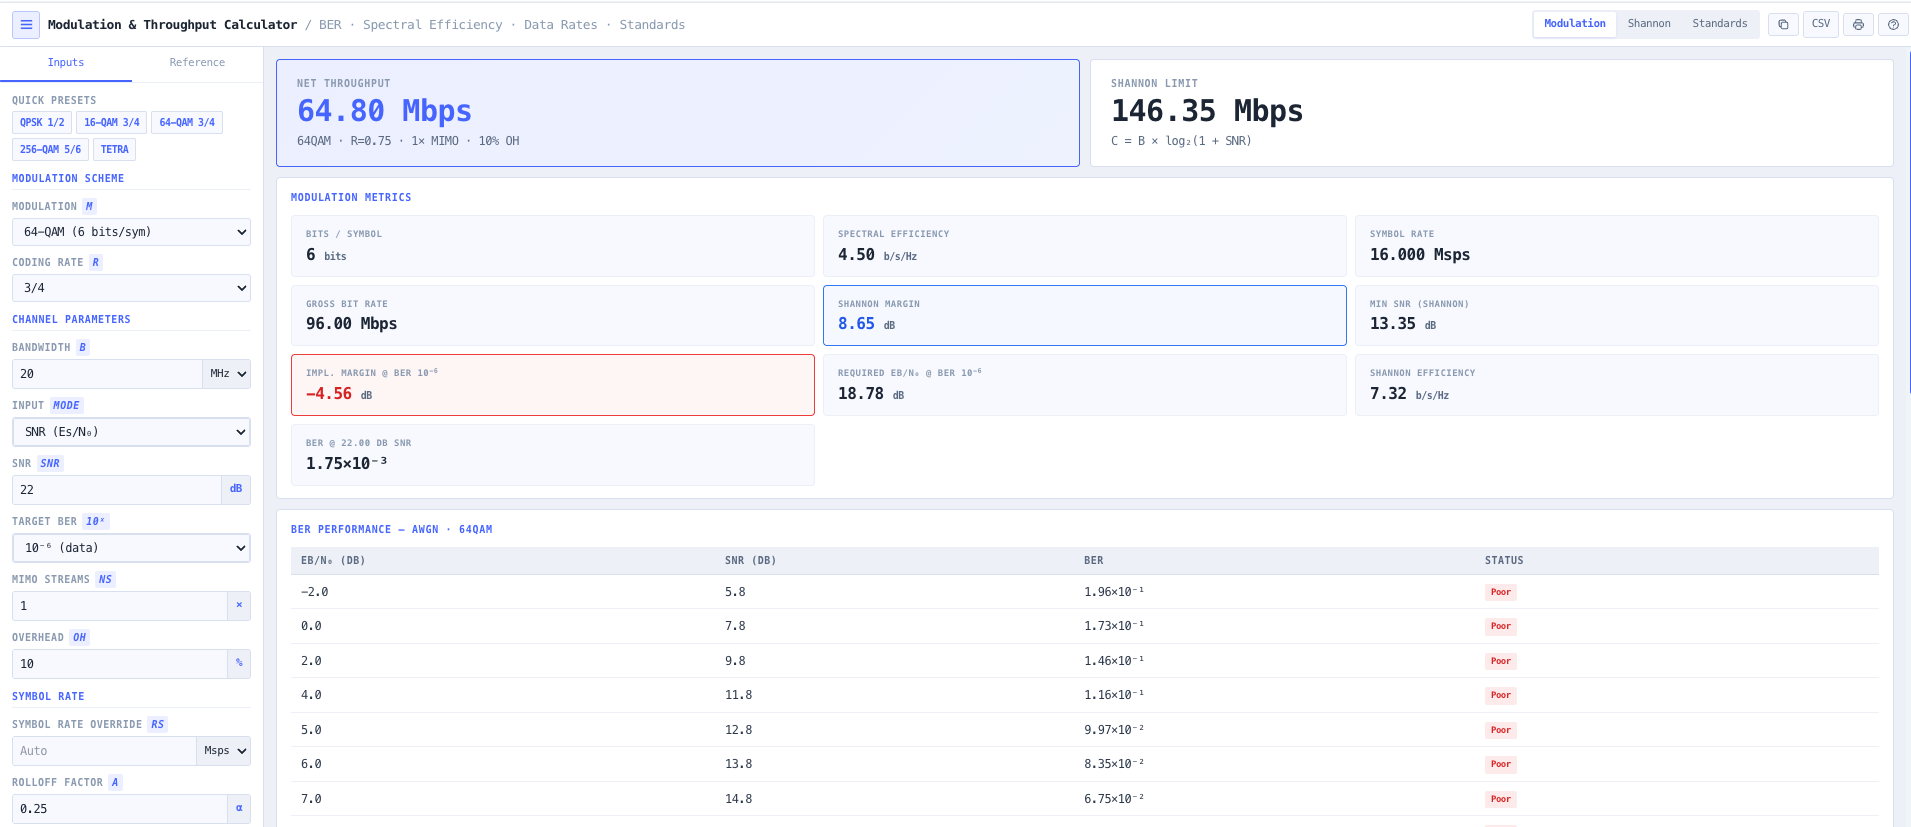
The noIM₃ Modulation and Throughput Calculator covers all four together. Modulation analysis selects from any scheme between BPSK and 4096 QAM, with FSK and GMSK families included for narrowband PMR work. Output covers bits per symbol, spectral efficiency in bits per second per Hz (eta equals log base 2 of M times R), symbol rate, gross bit rate, net throughput after overhead, and BER versus SNR in AWGN computed from the exact Q function for PSK, rectangular QAM, and FSK. SNR margin against the Shannon limit is reported alongside a quality classification.

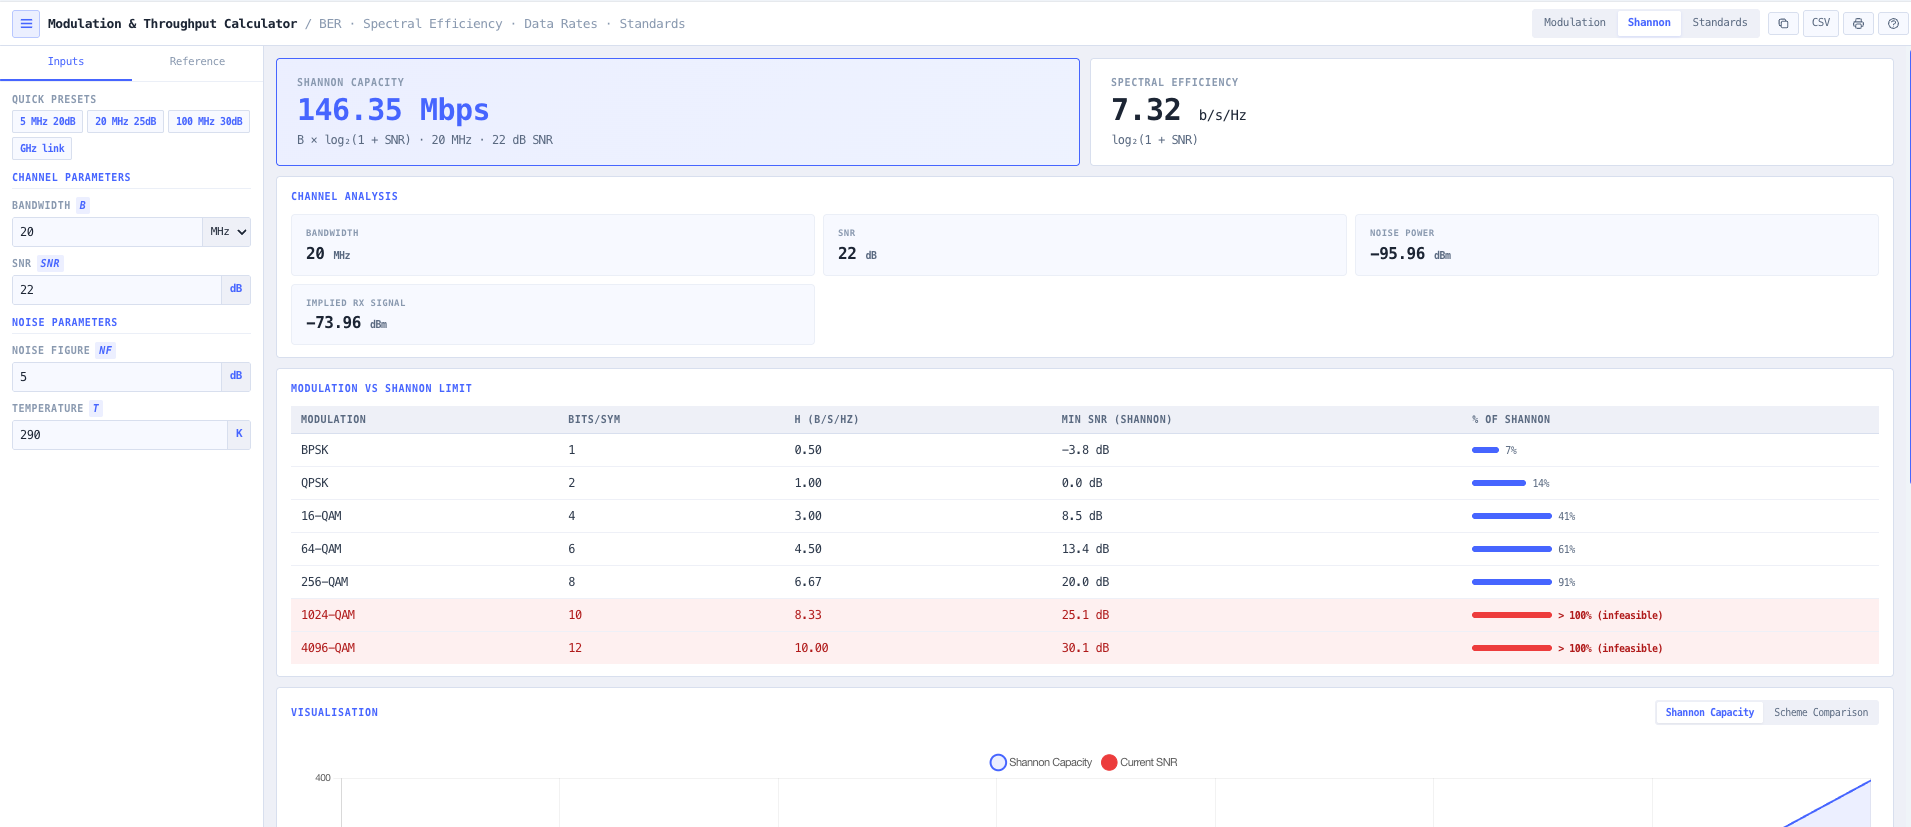
Shannon Hartley channel capacity (C equals B times log base 2 of (1 plus SNR)) is computed at any operating point against configurable bandwidth, SNR, noise figure, and system temperature. A comparison table benchmarks practical modulation schemes against the Shannon limit at the current operating point. Standards based MCS throughput covers the major digital standards in use today. LTE MCS 0 to 15. 5G NR FR1 with 1024 QAM (MCS 0 to 27) and FR2 mmWave. WiFi 5, WiFi 6, and WiFi 7 (including 4096 QAM MCS 13). DVB T2 and DVB S2 MODCOD tables. TETRA, DMR Tier II and III, and P25 Phase 2 for PMR work. Configure channel bandwidth and MIMO layers to compute a first-order modelled peak throughput, calibrated against published 3GPP and IEEE peak data rates.

Capabilities

Modulation analysis (BPSK to 4096 QAM)

Select any modulation scheme from BPSK through QPSK, 8 PSK, 16 PSK, 16 QAM, 32 QAM, 64 QAM, 128 QAM, 256 QAM, 512 QAM, 1024 QAM, and 4096 QAM, with BFSK, MSK, and GMSK for narrowband PMR. Output covers bits per symbol, symbol rate, gross bit rate, net throughput after coding rate and overhead, and spectral efficiency in bits per second per Hz.


BER versus SNR in AWGN

Bit error rate computed using exact Q function formulas for PSK (Gray coded), rectangular QAM, and FSK families. Curves rendered across the SNR range so you can read the required SNR for a target BER directly. Useful for receiver sensitivity validation, modem specification cross check, and SNR margin work.

Shannon Hartley capacity

Theoretical channel capacity computed using C equals B times log base 2 of (1 plus SNR) with configurable bandwidth, SNR, noise figure, and system temperature. A comparison table benchmarks practical modulation schemes against the Shannon limit at the current operating point, showing percentage of theoretical capacity achieved by each scheme.

Standards based MCS throughput

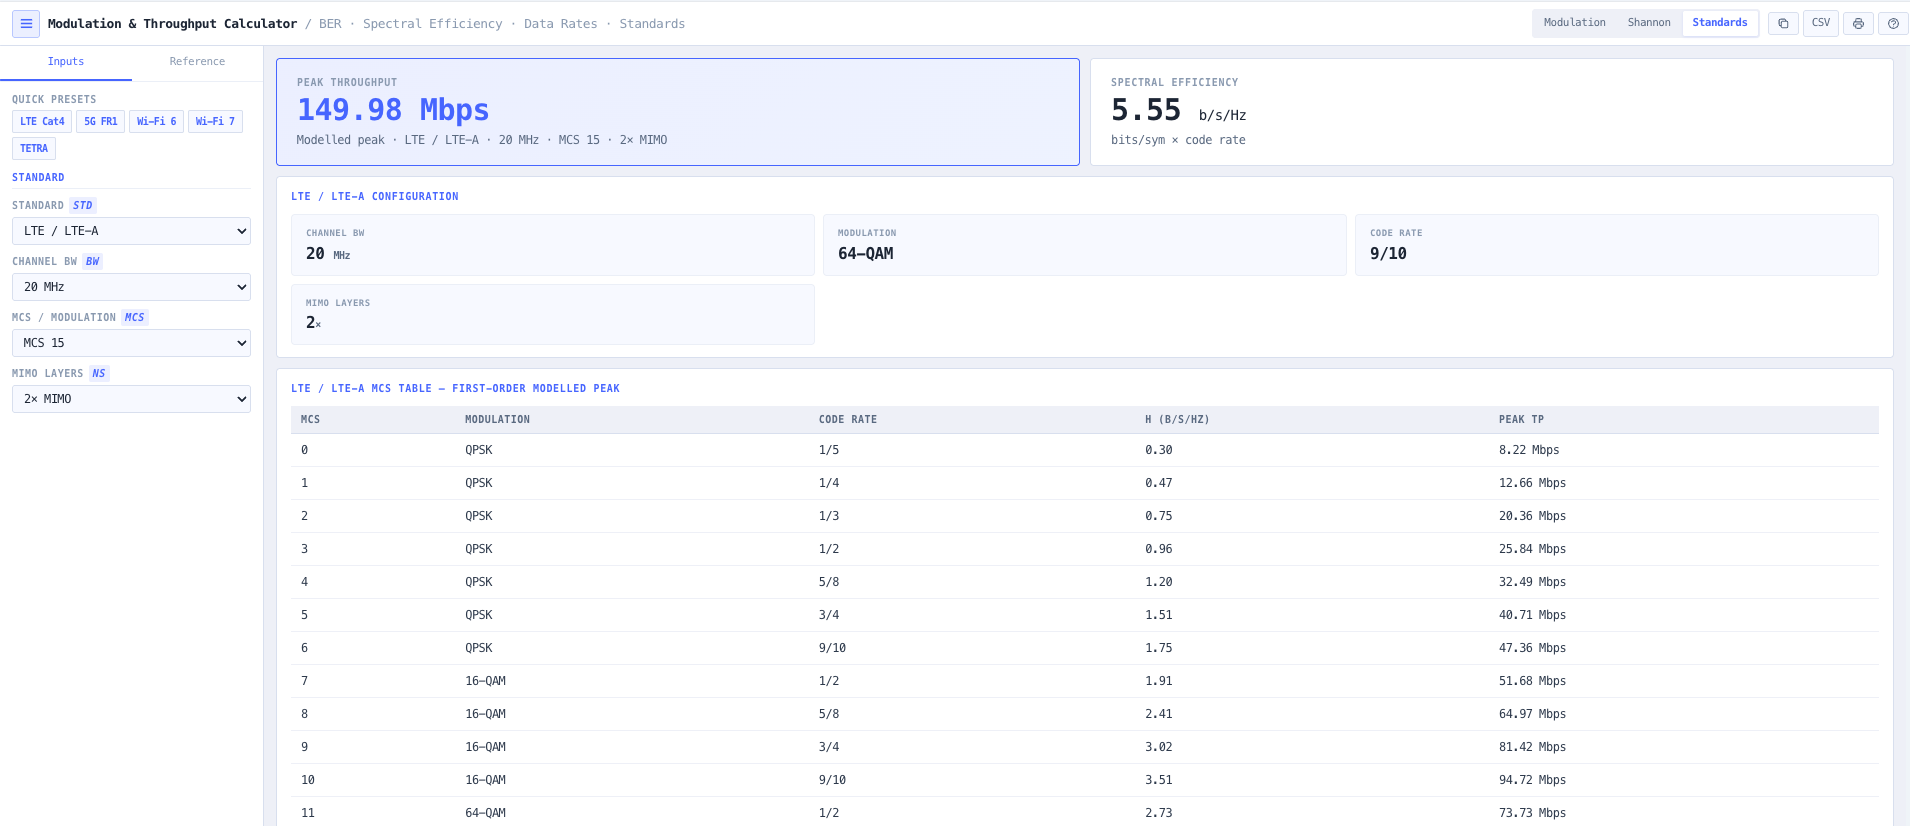
Built in MCS tables for LTE (MCS 0 to 15) and LTE Advanced. 5G NR FR1 with 1024 QAM (MCS 0 to 27) and FR2 mmWave. WiFi 5 (802.11ac), WiFi 6 (802.11ax), and WiFi 7 (802.11be) including 4096 QAM MCS 13. DVB T2 and DVB S2 MODCOD tables. TETRA, DMR Tier II and Tier III, and P25 Phase 2 for PMR. Configure channel bandwidth and MIMO layers to compute a first-order modelled peak throughput, calibrated against published 3GPP and IEEE peak data rates.

MIMO throughput scaling

Up to 32 spatial streams supported (5G NR FR2 maximum). MIMO multiplies the spectral efficiency of the underlying modulation, so the throughput output reflects the per layer modulation scheme, the spatial multiplexing gain, and any antenna configuration constraints set by the standard.

SNR margin and quality classification

Compares the configured operating SNR against the minimum required SNR for the chosen modulation scheme and BER target. Reports the margin in dB alongside a quality classification (excellent, good, marginal, insufficient). Useful for fast feasibility decisions during link budget development.

Interactive visualisation

Chart based output covering BER versus SNR curves for each modulation family, throughput versus SNR comparison across schemes, spectral efficiency bar charts by coding rate, Shannon capacity curves with operating point overlay, and MCS throughput and minimum SNR bar charts for the selected standard.

Browser only computation

Runs entirely in your browser. No modulation parameters, MCS configurations, or design data are submitted to a server. Useful for commercially confidential infrastructure work and environments where information security policy prohibits sending engineering data to third party services.

Standards & methodology

  • 3GPP TS 36.213. LTE MCS index and modulation order tables
  • 3GPP TS 38.214. 5G NR MCS index and modulation order tables
  • IEEE 802.11ac, 802.11ax, 802.11be. WiFi 5, 6, and 7 MCS specifications
  • ETSI EN 302 755. DVB T2 system specification
  • ETSI EN 302 307. DVB S2 system specification
  • ETSI EN 300 392. TETRA voice and data
  • ETSI TS 102 361. DMR Tier II and Tier III
  • TIA TSB 102. APCO P25 Phase 2
  • Shannon (1948) mathematical theory of communication for channel capacity

When to use this tool

  • Link budget modulation selection and SNR margin validation
  • Comparing BER performance across PSK, QAM, and FSK families
  • Estimating 5G NR and LTE MCS throughput for first-order network planning
  • Benchmarking proposed modulation schemes against the Shannon limit
  • Designing DVB T2 and DVB S2 MODCOD selection for broadcast links
  • Checking TETRA, DMR, and P25 channel efficiency for PMR networks
  • Teaching digital communications fundamentals (spectral efficiency, BER, capacity bounds)
  • Sanity checking vendor modem datasheet sensitivity claims against AWGN BER theory
  • Sizing MIMO configurations against required peak throughput targets
  • Producing MCS throughput evidence for customer engineering reports
  • Estimating whether a proposed 5G NR FR2 mmWave deployment is in range of target peak rates
  • Comparing WiFi 6 versus WiFi 7 throughput in 4096 QAM MCS 13 conditions

Is this the right tool for you?

Reach for the Modulation and Throughput Calculator in any of the following situations.

  • You are sizing a 5G NR FR1 deployment and need peak downlink throughput at the configured bandwidth, MIMO configuration, and MCS table to validate a coverage and capacity plan.
  • You are evaluating a WiFi 6 versus WiFi 7 deployment and need a like for like throughput comparison including the new 4096 QAM MCS 13 mode introduced by WiFi 7.
  • You are designing a microwave or millimetre wave point to point link and need to choose between QPSK, 16 QAM, 64 QAM, and 256 QAM against the available SNR and BER target.
  • You are validating a vendor modem datasheet sensitivity claim against the underlying AWGN BER theory and want to confirm the required SNR for the claimed BER.
  • You are benchmarking a proposed modulation scheme against the Shannon Hartley limit at the operating point and want to see what percentage of theoretical capacity it achieves.
  • You are designing a DVB T2 broadcast link or a DVB S2 satellite link and need MODCOD selection to meet the target carrier to noise margin under realistic propagation conditions.
  • You are sizing a TETRA, DMR Tier II, DMR Tier III, or P25 Phase 2 PMR network and need channel efficiency and peak throughput per channel for capacity planning.
  • You are evaluating whether to deploy 1024 QAM in 5G NR FR1 against a particular antenna and propagation environment and need to see the SNR cliff against the alternative 256 QAM.
  • You are sanity checking a 5G NR FR2 mmWave deployment claim that 64 QAM at 100 MHz channel bandwidth with 4 layer MIMO will deliver a target peak rate.
  • You are training new RF and digital engineers in modulation and coding fundamentals and want a teaching tool that exposes BER, spectral efficiency, and Shannon capacity together.
  • You are responding to a customer engineering enquiry about why their LTE or 5G throughput is lower than the marketing peak and need MCS based output that explains the dependence on SNR.
  • You are evaluating different coding rates for a custom satellite or terrestrial link and need to see the spectral efficiency and BER trade off across coding rates.
  • You are sizing the MIMO configuration for a 5G NR FR2 deployment to meet a required peak throughput and need to see how spectral efficiency scales with the number of spatial layers.
  • You are responsible for a regional or remote LTE deployment and need to confirm that the link supports a particular MCS at the typical SNR seen at the cell edge.
  • You are operating under a security regime that prohibits sending design data to third party services and need a calculator that runs entirely in your browser.

Frequently asked questions

Which modulation schemes are supported?

BPSK, QPSK, 8 PSK, 16 PSK, 16 QAM, 32 QAM, 64 QAM, 128 QAM, 256 QAM, 512 QAM, 1024 QAM, and 4096 QAM. BFSK, MSK, and GMSK are also covered for narrowband PMR work. BER versus SNR is computed from exact Q function formulas for PSK (Gray coded), rectangular QAM, and FSK (non coherent) families.

How is the Shannon limit used here?

The Shannon Hartley channel capacity C equals B times log base 2 of (1 plus SNR) gives the theoretical maximum data rate at a given bandwidth and signal to noise ratio. The calculator computes C at the operating point and benchmarks every practical modulation scheme against it as a percentage. A 50 per cent of Shannon link is a competitive design. A 90 per cent of Shannon link is at the practical edge of what coding can achieve. Useful for understanding how much headroom is left in the channel before considering bandwidth or SNR upgrades.

What does spectral efficiency mean?

Spectral efficiency in bits per second per Hz is the data rate per Hz of channel bandwidth. Eta equals log base 2 of M times R, where M is the modulation order and R is the coding rate. BPSK at full rate is 1 b per s per Hz. 64 QAM at 5 over 6 coding rate is 5 b per s per Hz. 256 QAM at 3 over 4 coding rate is 6 b per s per Hz. 1024 QAM at 5 over 6 coding rate is 8.33 b per s per Hz. The calculator surfaces eta directly so dense modulation modes can be compared on a like for like basis.

Which digital standards are supported?

LTE MCS 0 to 15 and LTE Advanced. 5G NR FR1 with 1024 QAM (MCS 0 to 27) and FR2 mmWave. WiFi 5 (802.11ac), WiFi 6 (802.11ax), and WiFi 7 (802.11be including 4096 QAM MCS 13). DVB T2 and DVB S2 MODCOD tables. TETRA, DMR Tier II, DMR Tier III, and P25 Phase 2. Configure channel bandwidth and MIMO layers to compute a first-order modelled peak throughput, calibrated against published 3GPP and IEEE peak data rates.

How is MIMO throughput scaling handled?

Up to 32 spatial streams are supported, matching the maximum specified by 5G NR FR2. MIMO scales the spectral efficiency of the underlying modulation linearly under ideal channel conditions, so peak throughput equals per layer modulation throughput times the number of spatial layers. Real world MIMO efficiency depends on channel conditions, antenna correlation, and processing capability, but the peak number is what 3GPP and IEEE peak throughput claims reference.

What is the difference between gross bit rate and net throughput?

Gross bit rate is the total bit rate transmitted including coding and protocol overhead. Net throughput is what the application actually receives after coding rate is applied (subtracting forward error correction redundancy) and protocol overhead is removed (control, pilot, framing). Net throughput is the number that actually matters for capacity planning and end user performance.

How does this support link budget work?

The required SNR for a chosen modulation and BER target feeds directly into the link budget as the receiver sensitivity threshold. The noIM₃ Link Budget Calculator consumes the required SNR and computes the link margin against the received power. Use the Modulation and Throughput Calculator to choose the scheme and identify the required SNR. Use the Link Budget Calculator to confirm whether the link delivers enough received power and SNR to support that scheme.

Does any data leave my browser?

No. The calculator runs entirely in your browser. No modulation parameters, MCS configurations, or design data are submitted to a server. Useful for commercially confidential infrastructure work and environments where information security policy prohibits sending engineering data to third party services.