How many DEM sources are wired and live?
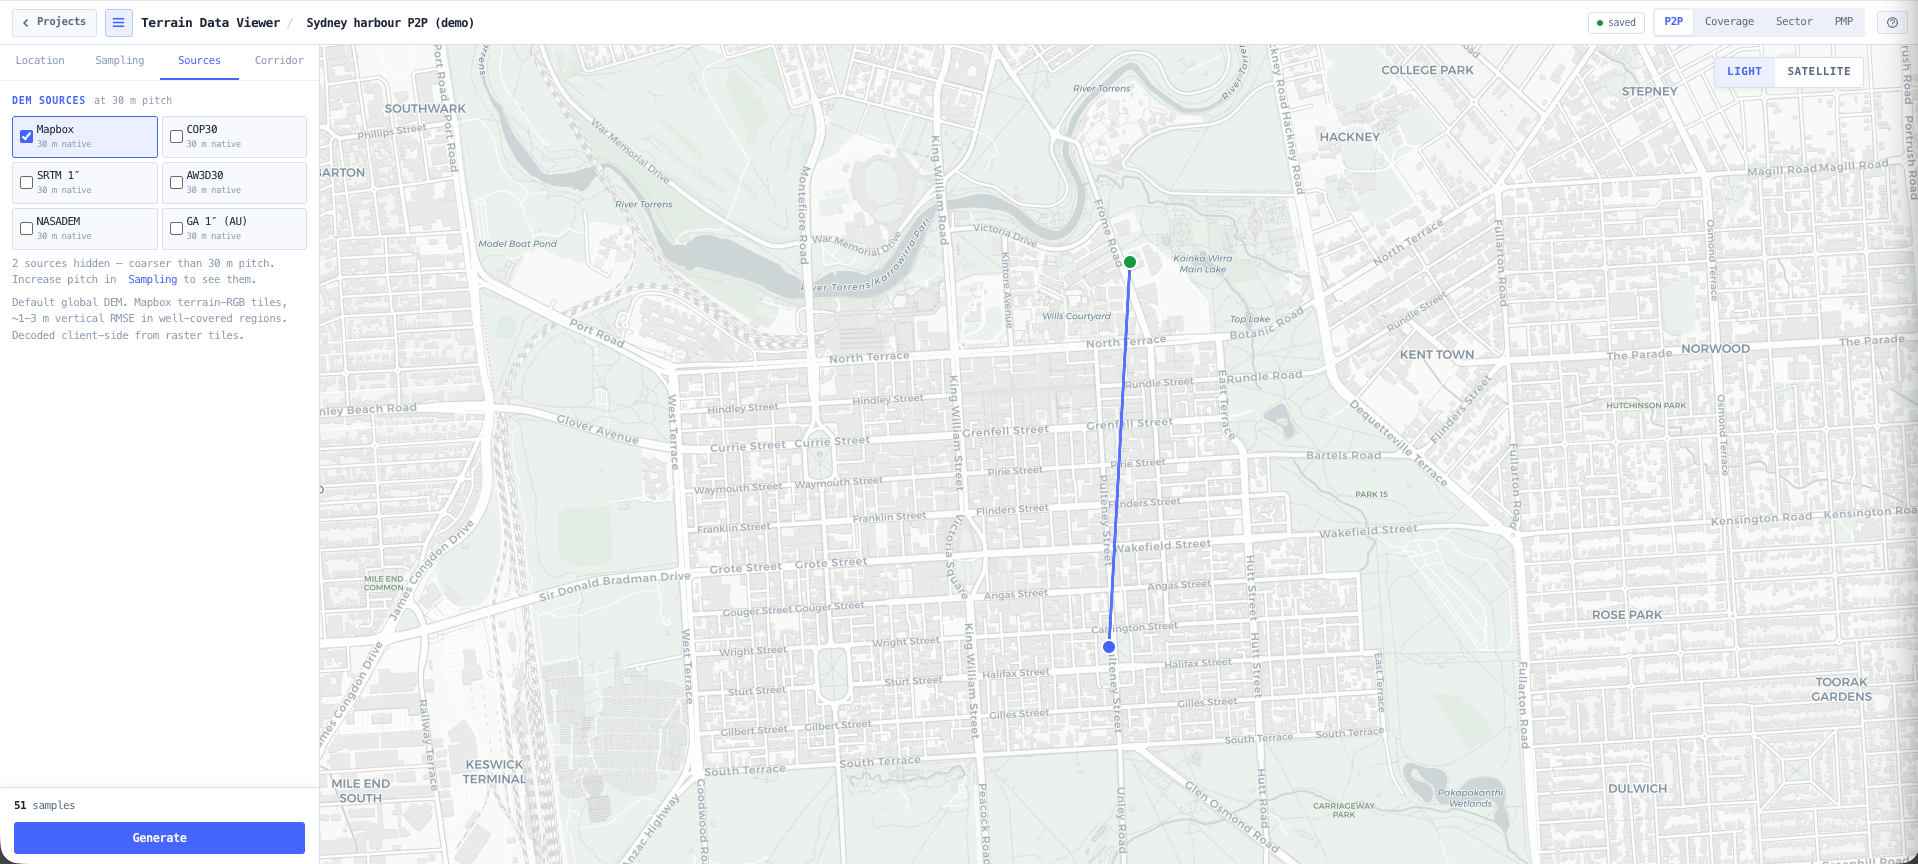
Eight, all live and server proxied: Mapbox Terrain RGB (zoom adaptive global), Copernicus GLO 30 and GLO 90 DSM (global including poles), NASA SRTM 1 arcsec and 3 arcsec (±60° latitude), ALOS World 3D 30 m DSM, NASADEM 1 arcsec, and Geoscience Australia 1 arcsec DEM (AU only). Copernicus, SRTM, ALOS, and NASADEM route through the noIM₃ server proxy to OpenTopography. Geoscience Australia routes through a separate proxy to the GA ArcGIS Image Service. No third party API key reaches the browser.
What does multi source merge do?
Tick two or more DEM sources and pick a strategy. First available walks the sources in priority order and takes the first non null sample per cell. Minimum takes the lowest elevation per cell across all contributing sources (worst case clearance). Maximum takes the highest (worst case obstruction). Mean and Median fold all contributing values per cell. Spread reports max minus min as a per cell uncertainty visualisation. Every merged cell carries the per source component values and the spread in the export, so downstream audit can reconstruct the merge.
How does the tool compute clutter heights?
Sources are tagged as bare earth DTM (Mapbox, Geoscience Australia 1″, SRTM, NASADEM) or surface DSM (Copernicus GLO 30 and 90, ALOS World 3D 30 m). When at least one of each is selected, the clutter AGL (DSM minus DTM) is computed per cell at merge time and populates the surface_elevation_m and clutter_agl_m columns in CSV, JSON, GeoJSON, and KML exports, plus the live cursor readout. Single source selection leaves clutter empty rather than fabricate building heights without a paired DTM reference.
How fine can the pitch be and how is that policed?
The pitch chips for 1, 5, 10, 30, and 90 m automatically grey out when the currently selected sources cannot honestly serve them. Mapbox Terrain RGB is zoom adaptive and serves down to ~1 m; every other source has a fixed native resolution and will grey the chips below it. Selecting a finer pitch than a source can serve auto deselects that source with an informational toast. Sub native pitches that the user accepts are bilinear interpolated by the tile fetcher and tagged interpolated equals true on every export, so engineers downstream do not mistake oversampled data for native fidelity.
What does the P2P corridor heatmap do?
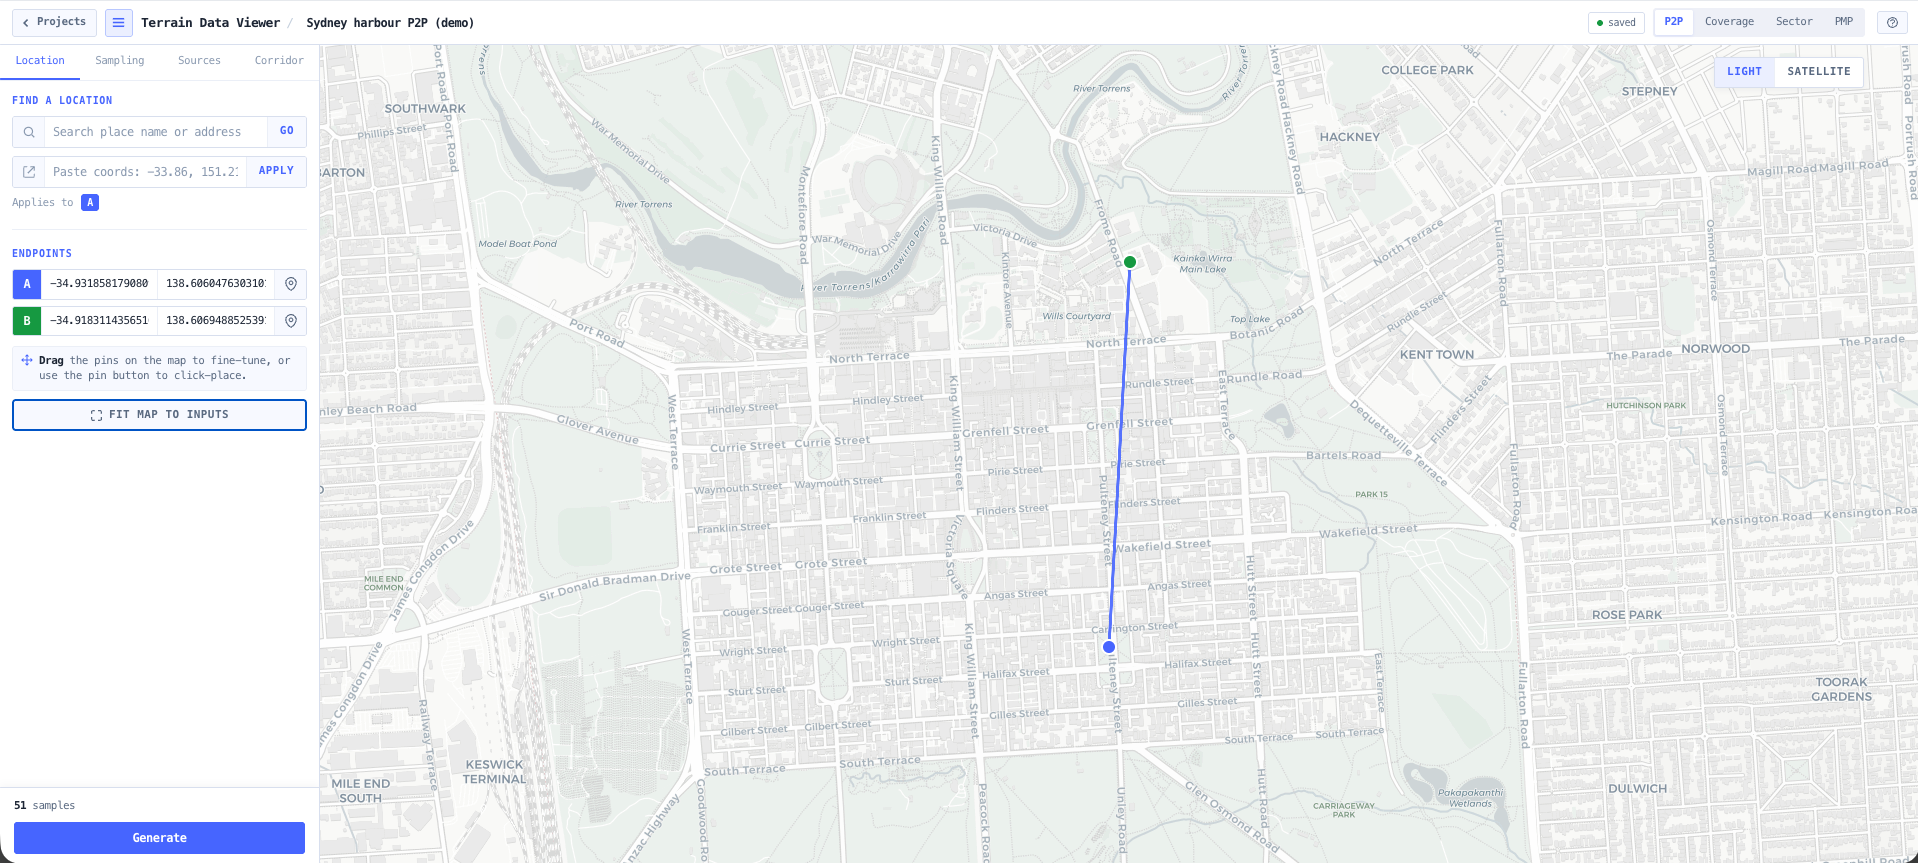
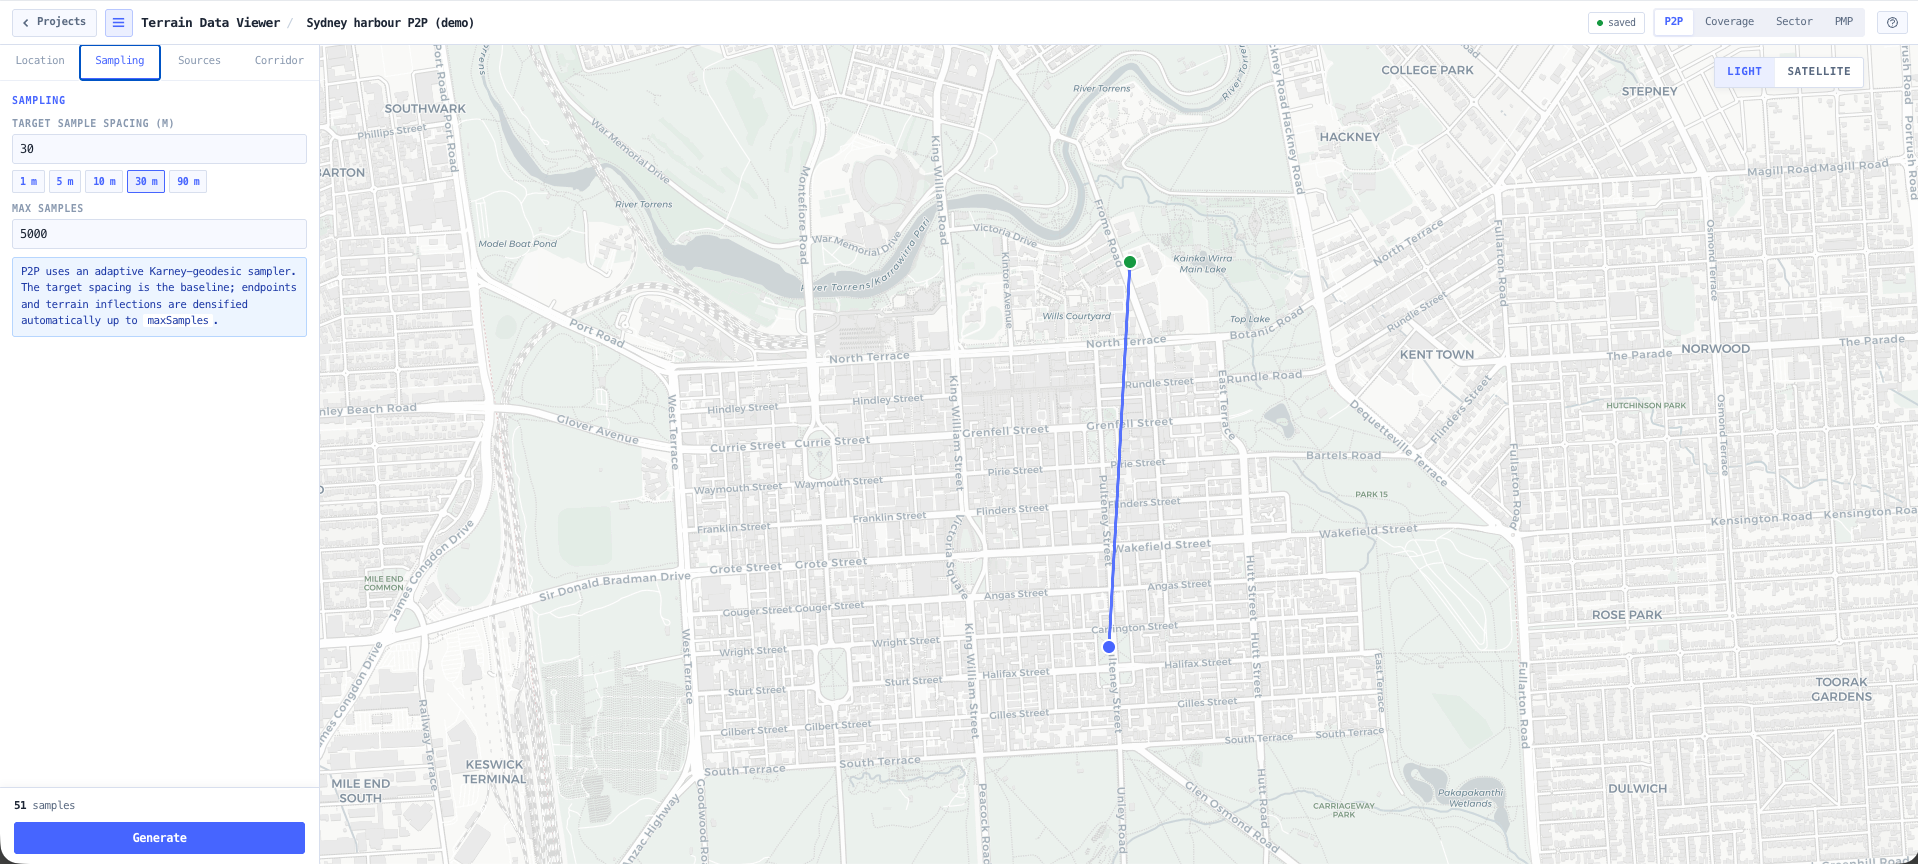
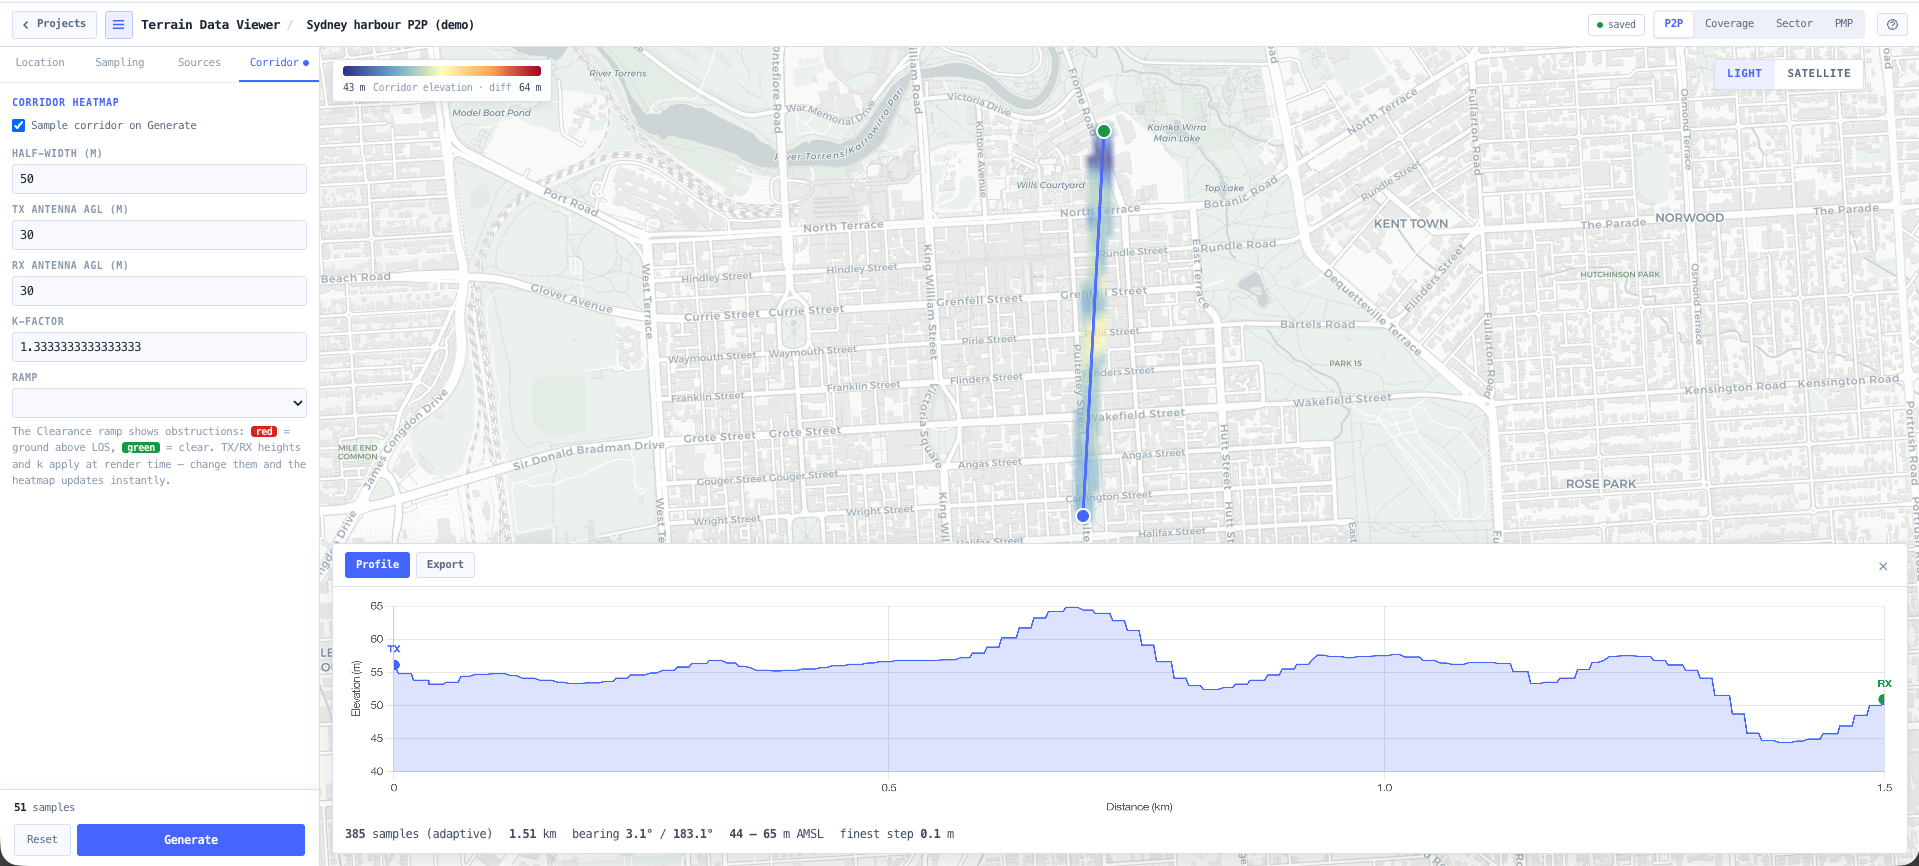
Toggle Sample corridor on Generate in the Corridor tab. The sampler renders a rectangular heatmap of user set half width (50 m to 20 km) either side of the great circle. Pick the Viridis or Terrain ramp for absolute elevation, or the Clearance ramp which subtracts the TX to RX line of sight with k factor Earth bulge correction and colours obstructions in red, clear ground in green. TX AGL, RX AGL, k factor, and ramp choice apply at render time so you can probe the geometry without re sampling the DEM.
What does Sector mode produce?
A pie slice DEM constrained to an apex, azimuth (degrees from north, clockwise), beam width (1° to 360°, with an omni preset), and range (0.1 km to 100 km). Cells outside the wedge are masked transparent on the heatmap. A draggable boresight handle on the map lets you rotate and adjust the range live without typing. The same probe, 8 rose, cursor readout, and export pipeline as Coverage mode applies, and the export tags wedge bounds in the sample metadata.
What does PMP mode produce?
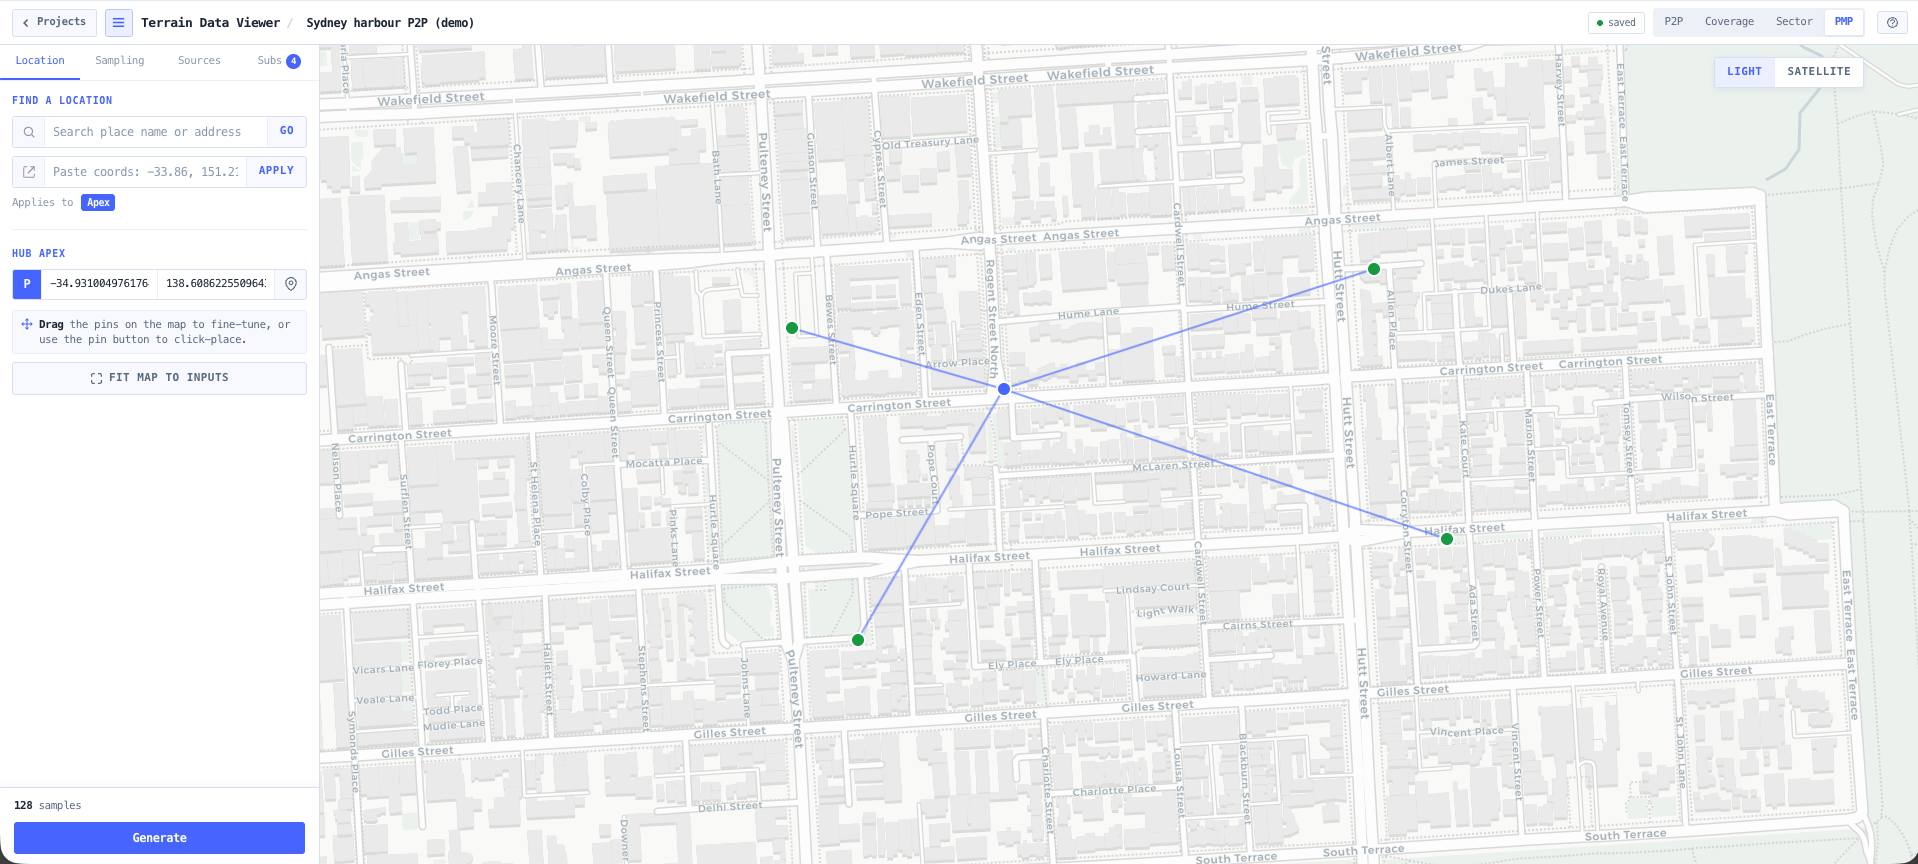
One elevation profile per subscriber from a single hub apex, up to 100 subscribers. Each subscriber has a name, latitude, and longitude (arm to click on the map or paste). Generate samples each apex to subscriber path with the same Karney geodesic adaptive sampler as P2P mode, with live results as each subscriber finishes. The dock shows a summary table (distance, bearing, sample count, error) and a per subscriber elevation chart. Export a summary CSV, per subscriber profile CSV, or a GeoJSON of all paths. PMP intentionally has no LOS, Fresnel, or clearance analysis baked in — downstream RF tools own the radio modelling.
What export formats are supported?
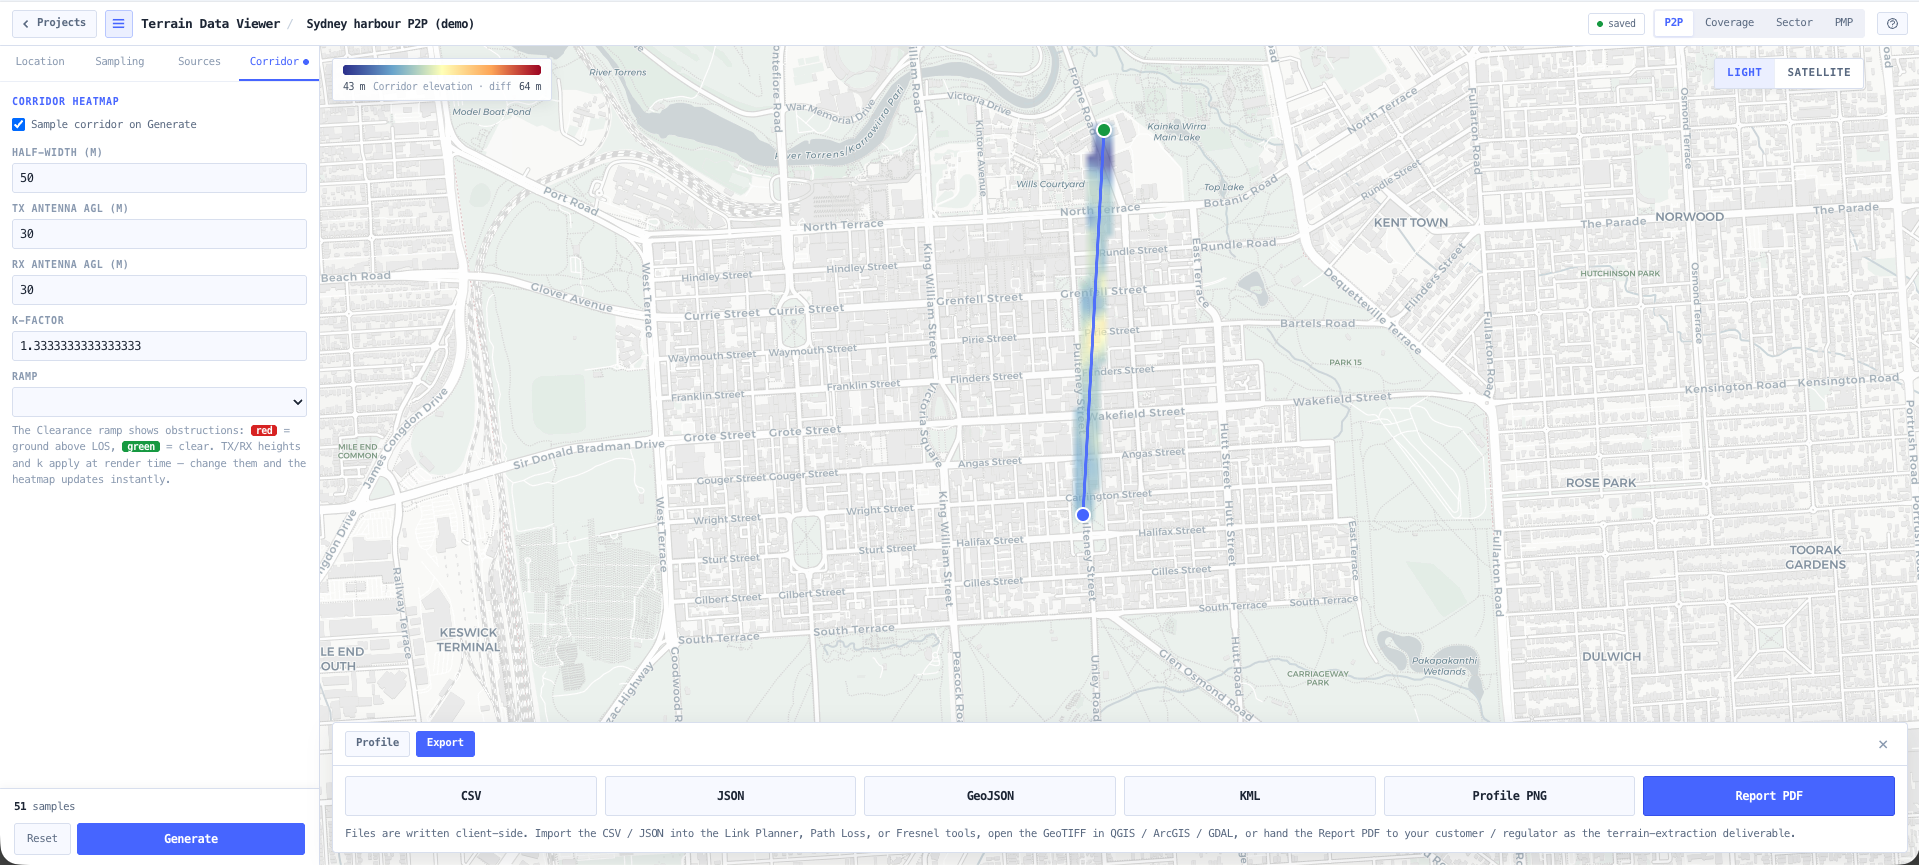
CSV with header comments and per sample source, version, and resolution columns. Native JSON matching the noIM₃ profile sample shape for re ingest. GeoJSON FeatureCollection of points. KML for Google Earth (full P2P, sub sampled for large coverage and sector grids). Float32 single band EPSG:4326 GeoTIFF with GDAL_NODATA equals -32768 for QGIS, ArcGIS, and GDAL. Profile PNG of the elevation chart. PMP exports a summary CSV plus per subscriber profile CSVs and a GeoJSON of all paths. The GeoTIFF is a hand rolled minimal classic TIFF with the GeoKey tags written inline so it loads cleanly in any compliant reader without sidecar files.
Can the output be imported into other noIM₃ tools?
Yes. The CSV and JSON outputs match the noIM₃ profile sample shape used by the Link Planner, Path Loss, Fresnel, and ITU R P.530 / P.526 / P.1812 tools. The intent is download once from the Terrain Data Viewer, import into whichever downstream tool needs it. Direct in app handoff is intentionally not supported, so the same files also work for offline analysis, sharing with colleagues, and external GIS workflows.
How does this compare to the elevation profile inside the Link Planner?
The Link Planner generates an elevation profile internally for its own ITU R P.526 / P.530 / P.452 link budget. The Terrain Data Viewer is a stand alone tool that produces the same data with full export to common formats, plus three additional geometries (Coverage, Sector, PMP), multi source merge, and a corridor heatmap. Both share the same TerrainProvider interface, the same Karney geodesic, and the same tile cache, so the data is consistent across tools.
Does the GeoTIFF include the projection information?
Yes. The GeoTIFF carries ModelPixelScaleTag and ModelTiepointTag for the affine geo transform, plus a GeoKeyDirectoryTag declaring GTModelTypeGeoKey equals Geographic, GTRasterTypeGeoKey equals PixelIsArea, GeographicTypeGeoKey equals 4326 (WGS84), and GeogAngularUnitsGeoKey equals degree. The GDAL_NODATA tag is set to -32768 for sample positions where the DEM had no coverage. The file loads cleanly in QGIS, ArcGIS, GDAL, and any compliant GeoTIFF reader.
Does any data leave my browser?
Mapbox Terrain RGB tiles are fetched directly from your browser to the Mapbox CDN through the noIM₃ persistent tile cache. Copernicus, SRTM, ALOS, NASADEM, and Geoscience Australia DEM queries route through noIM₃ server proxies that hold the OpenTopography API key server side, so no third party credential is exposed to the browser. The proxies pass through the bounding box and points for the requested cells but do not persist them. No path geometry, location, or output data is submitted to a noIM₃ analytics or storage backend.
How accurate is the elevation data?
Mapbox Terrain RGB has ~1 to 3 m vertical RMSE in well covered regions. Geoscience Australia 1″ has ~3 to 5 m vertical RMSE across AU. Copernicus GLO 30 has ~2 to 4 m. ALOS World 3D has ~5 to 7 m and is often the best DSM in mountainous terrain. NASADEM has ~7 m. SRTM 1″ has ~7 to 10 m. SRTM 3″ has ~12 m. Vertical accuracy degrades in poorly mapped regions, in dense vegetation, and over water. The export carries the source resolution and version per sample so downstream tools can disclose the accuracy of every cell.
Can the tool work outside Australia?
Yes. The map view defaults to Australia because that is our primary customer base, but the map permits free worldwide navigation and the global DEM sources (Mapbox, Copernicus GLO 30 and 90, SRTM 1″ and 3″, ALOS World 3D 30, NASADEM) all serve the whole world (SRTM and NASADEM cap at ±60° latitude). Geoscience Australia 1″ short circuits to null outside AU so the multi source dispatcher skips it cleanly for non AU samples.
How does the project save and load work?
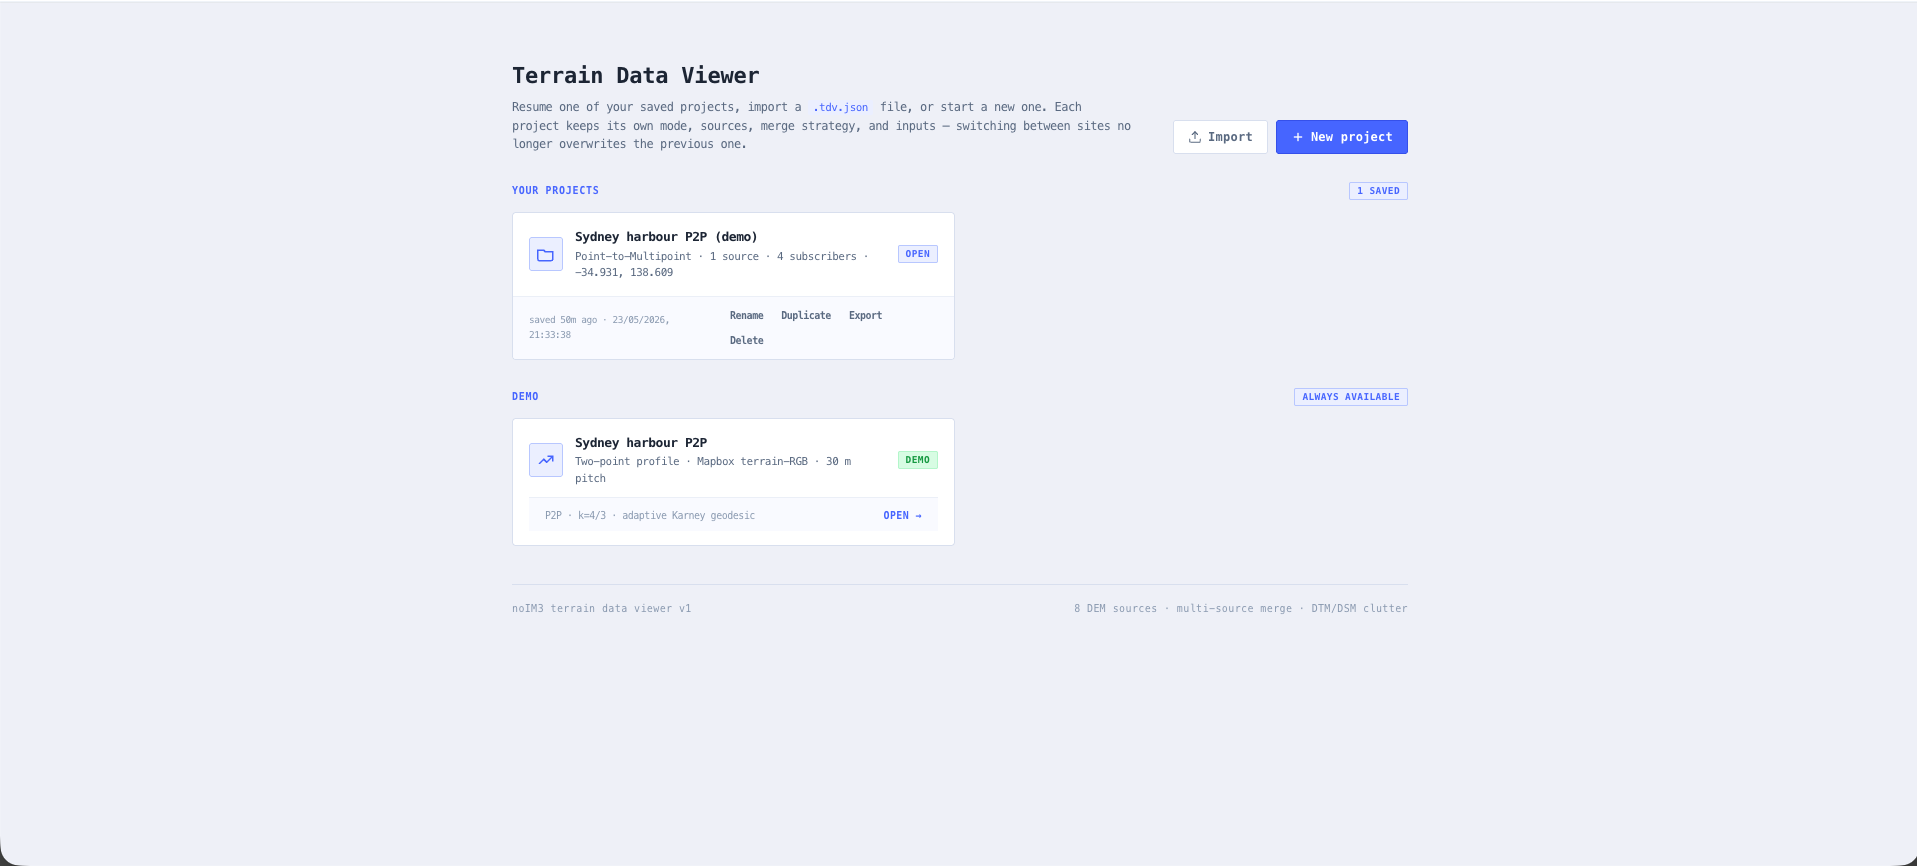
Every project has its own slot in browser storage keyed by a stable id. The picker (the page you land on when you open the tool) lists everything you have saved with mode, source count, anchor coordinate, and last saved time. Open Site 17 in the morning, switch to Site 18 in the afternoon, and Site 17 keeps its inputs intact. Rename inline in the top bar (input expands to fit the name, capped at 60 characters), duplicate, export to a .tdv.json file, or import a colleagues file from another machine. Active project autosaves to its own slot on every input change; the top bar carries a live "saved Xs ago" pill copied from the HF link planner. Cross tab storage events keep the picker in sync if you delete a project in another tab. Sampled results are not persisted (they are several MB each and would exhaust the browser storage quota), so opening a saved project re runs sampling on demand against the same inputs.
What does the PDF report include?
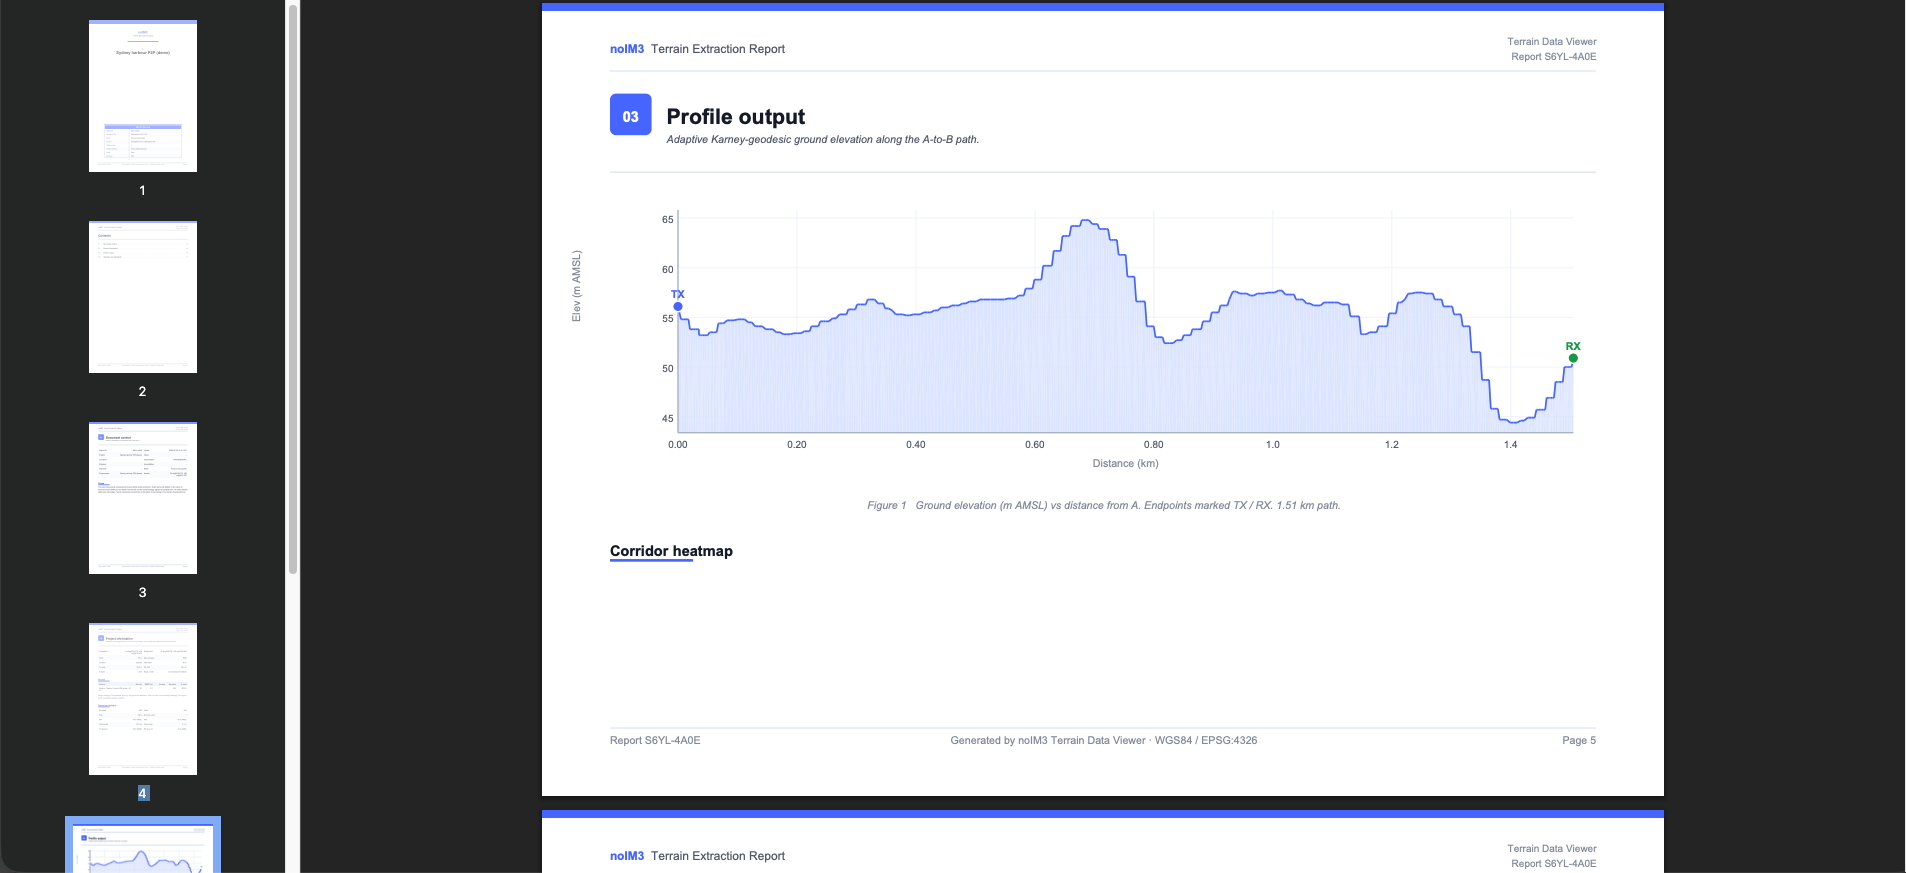
A multi page A4 document with a cover (project name, mode, anchor, report ID, issued UTC, sources, merge strategy, pitch, sample count, optional engineer of record), table of contents, document control kvSheet, consolidated project information section (geometry, sources, merge, sampling statistics), a mode specific output section on landscape pages, and a closing glossary and standards table. P2P landscape pages render the elevation profile natively in jsPDF vector lines so the chart is sharp at any zoom (no rescale fuzz). Coverage and Sector ship three landscape figures each — elevation heatmap, Mapbox satellite view of the same bounding box, and a satellite + heatmap composite at 55 percent opacity that lets the engineer see terrain against ground truth landmarks like roads and coastline. PMP renders the per subscriber summary table on portrait then one landscape elevation profile per subscriber. The report deliberately carries no frequency dependent analysis (Fresnel, link budget, rain attenuation) — those belong in the Link Planner and Fresnel calculator. Mirrors the design system of the HF link planner report for cross tool consistency.
Can I drag the pins on the map to move sites?
Yes. Every input pin is draggable on the map: P2P endpoints, coverage centre, sector apex, PMP hub apex, and per subscriber pins. The geometry updates live as you drag — for P2P the path line tracks the moving endpoint, for coverage the radius ring slides with the centre, for sector the wedge polygon and boresight handle slide with the apex, and for PMP every apex to subscriber line updates with whichever end is moving. In sector mode dragging the apex anchors the boresight tip in geographic space so the wedge twists to keep pointing at the same ground spot. Click placement (arm the pin button on a card and tap the map) is still available for keyboard friendly placement. PMP subscribers can be added in sticky mode: arm the pin button once and every map click drops a new subscriber until you press Esc or toggle the arm button.