High Frequency Radio

HF Link Planner

Full ITU P.533 HF propagation prediction with a 3D globe, point to point and area coverage modes, ACMA site integration, and live space weather conditioning.

Overview

High frequency sky wave propagation is the only reliable way to move voice and data over thousands of kilometres without satellites or terrestrial infrastructure. It is also one of the hardest physical layers to plan, because the ionosphere that makes the link possible is in constant motion, conditioned by solar activity, time of day, season, and geomagnetic storms. Operators who pick a frequency by intuition end up shouting into a band that is closed.

The noIM₃ HF Link Planner is a complete implementation of ITU Recommendation P.533, the international standard for HF sky wave propagation prediction. It runs entirely in your browser on a full screen 3D globe. Click to place a transmit site, click again to place a receive site, and the engine returns a full link budget, ionospheric layer diagnostics, ranked frequency recommendations across the 2 to 30 MHz band, daily and monthly time of day curves, P.372 noise breakdown, and statistical reliability. Drop a single transmit site and you can generate a point to multipoint coverage map across the surrounding region in the same workflow.

Every prediction is conditioned on live space weather. F10.7 solar flux, sunspot number, and Kp are pulled from BOM Space Weather Services and NOAA SWPC, so the planner reflects the ionosphere you actually have right now, not a climatological average. Disturbed ionosphere warnings are surfaced when geomagnetic activity would degrade the predicted circuit. ACMA RadCom integration lets you populate transmitter coordinates by licence or callsign, removing manual entry errors and making coordination, licence application, and validation workflows considerably faster.

Capabilities

ITU P.533 propagation engine

Complete P.533 implementation backed by P.1239 CCIR ionospheric maps, modified dip latitude coordinates, E layer and F2 layer MUF for multi hop modes (1E, 2E, 3E, 1F2, 2F2 and beyond), above MUF soft landing probability, P.531 D layer non deviative absorption, and field strength and SNR computation to P.533 Annex 1.

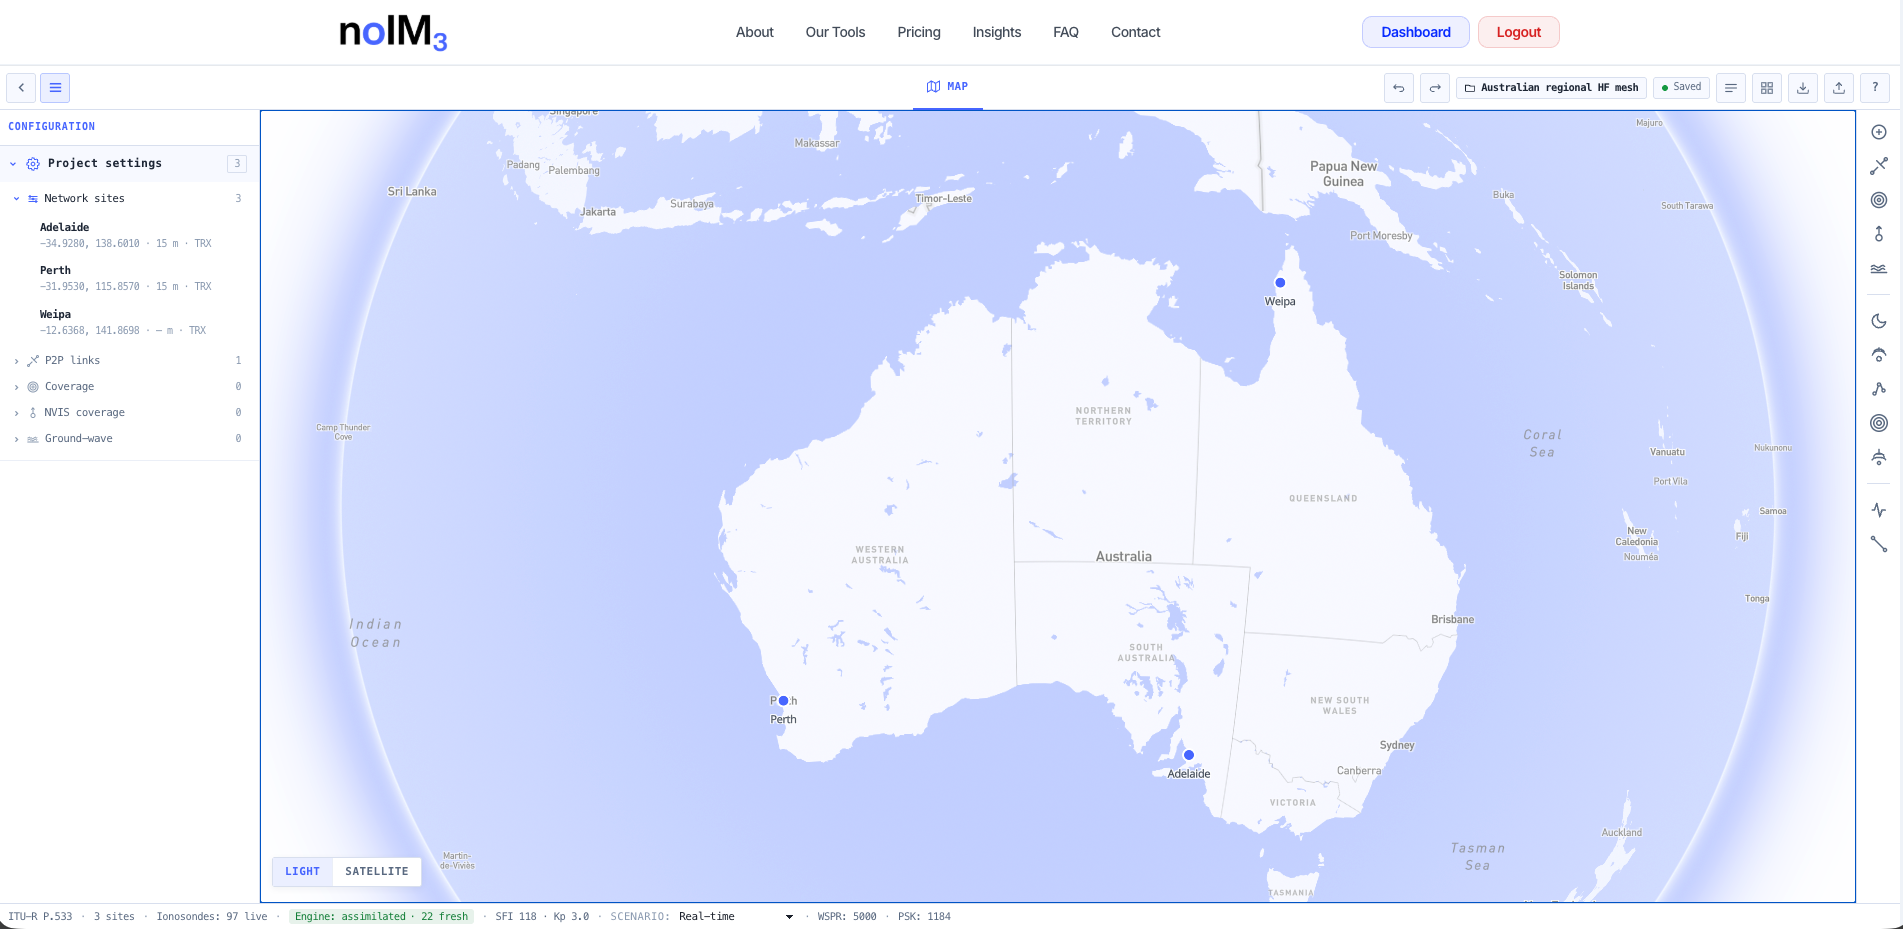
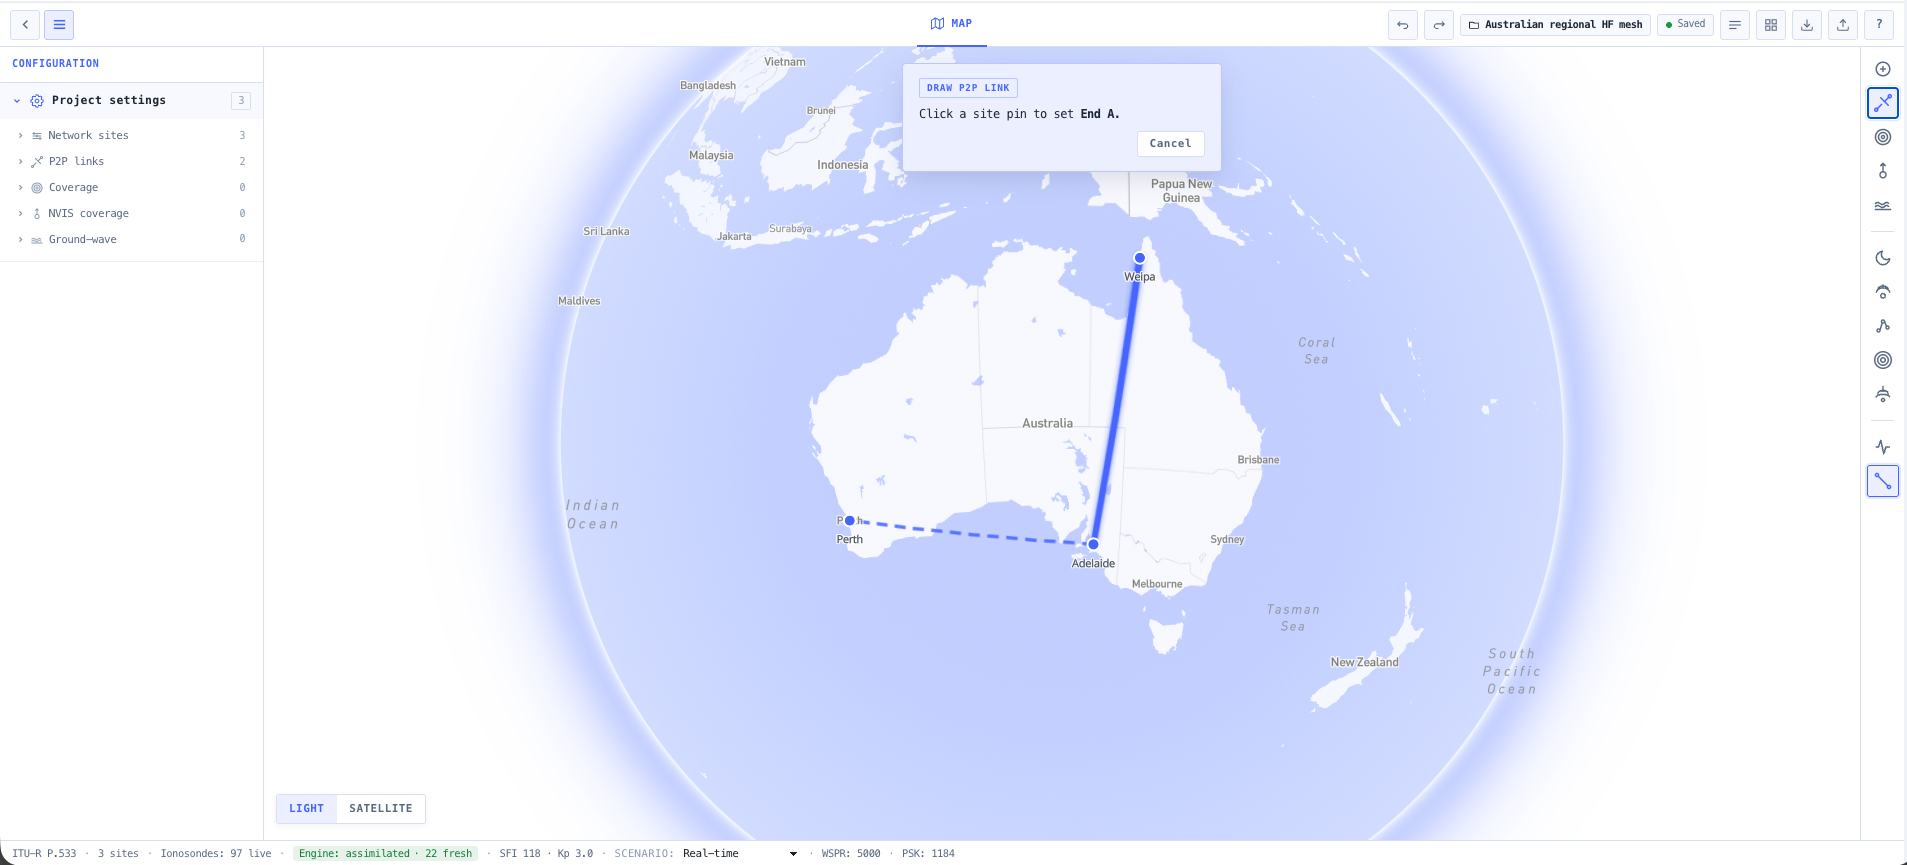
Interactive 3D globe

Full screen WebGL globe with click to place sites. Great circle path, hop geometry, and the day night terminator are drawn automatically. Floating site panels surface azimuth, back azimuth, and path distance in real time as you reposition.

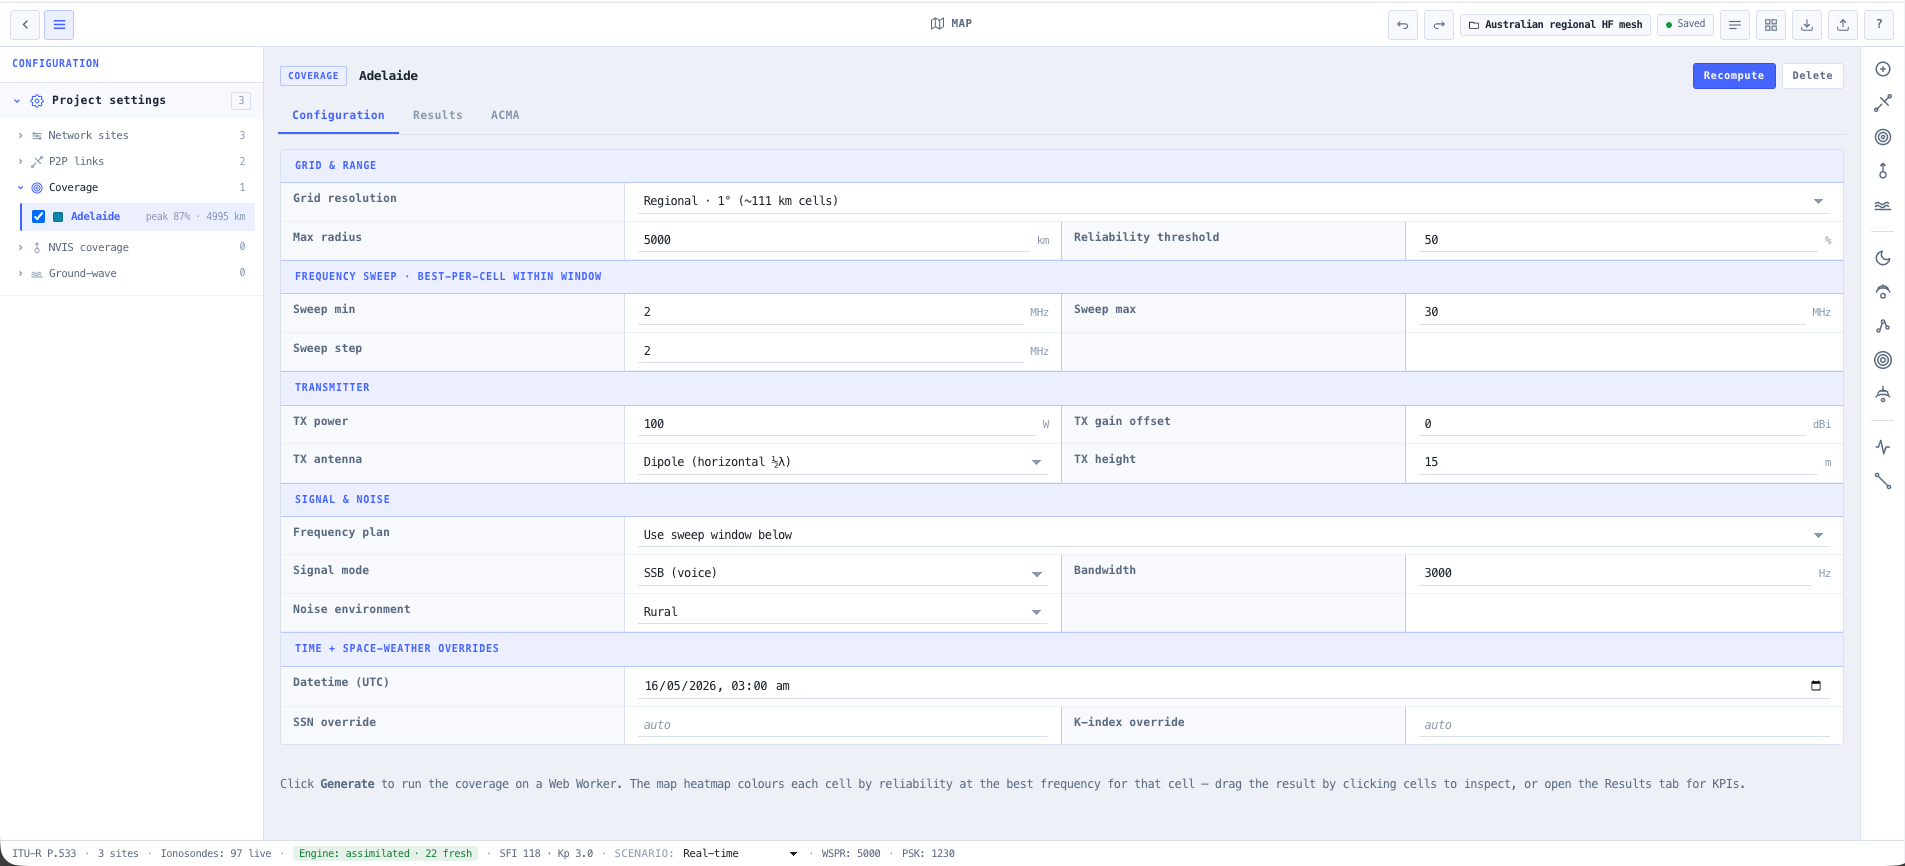
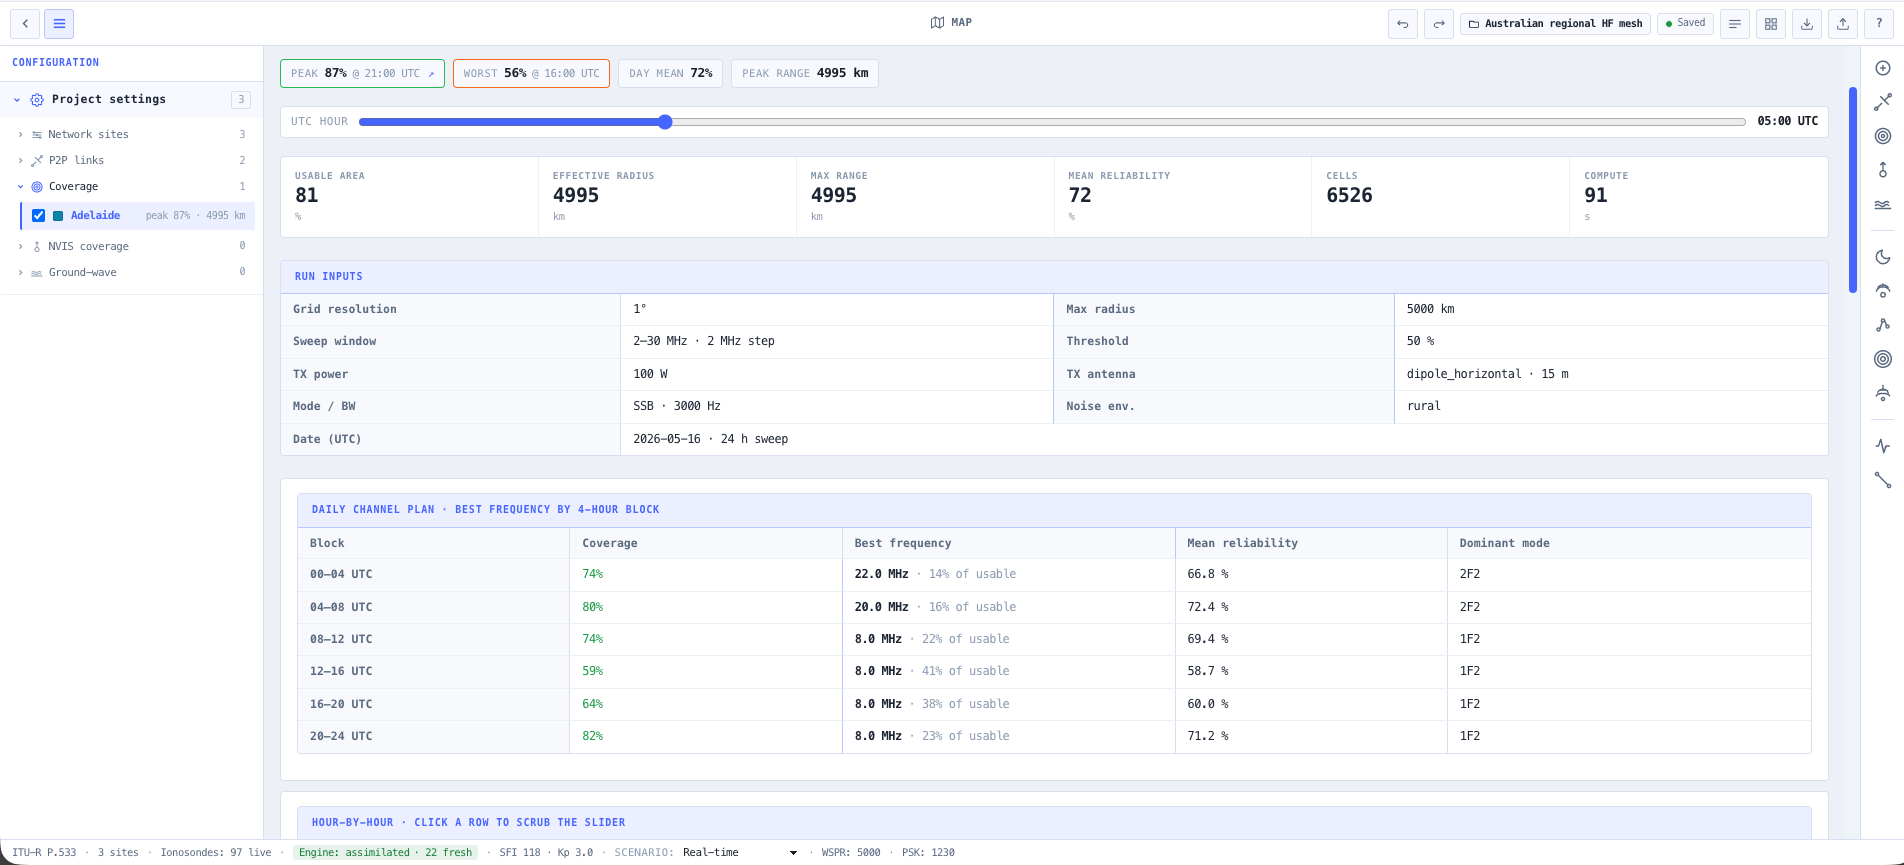
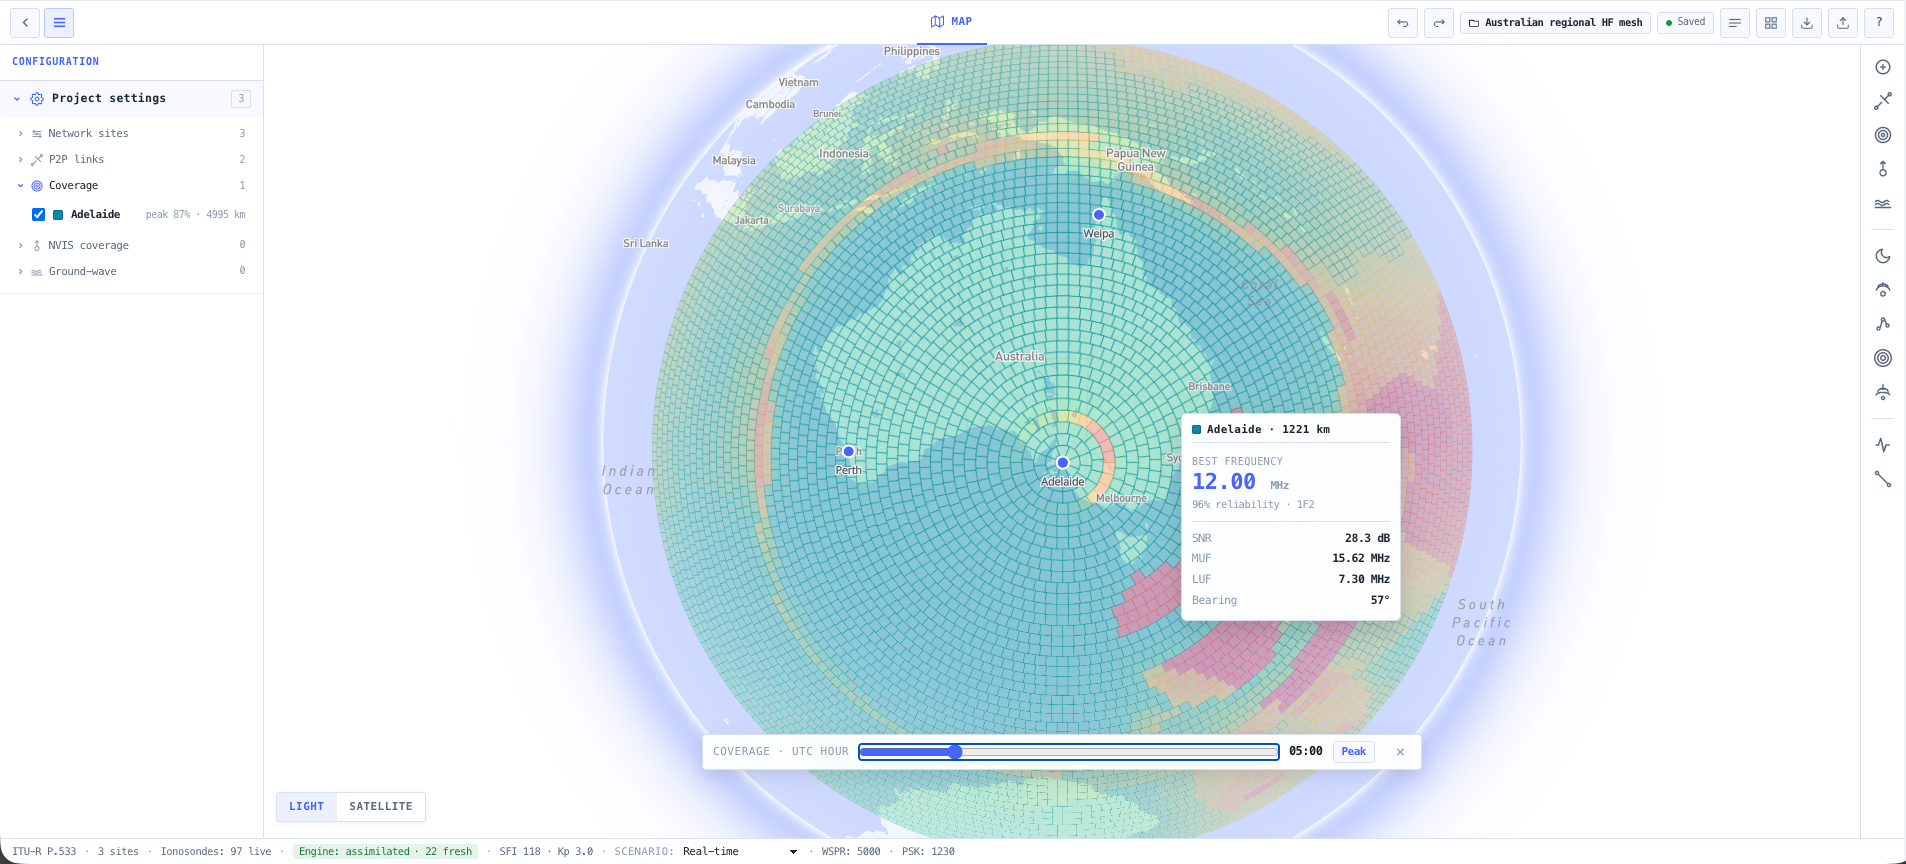
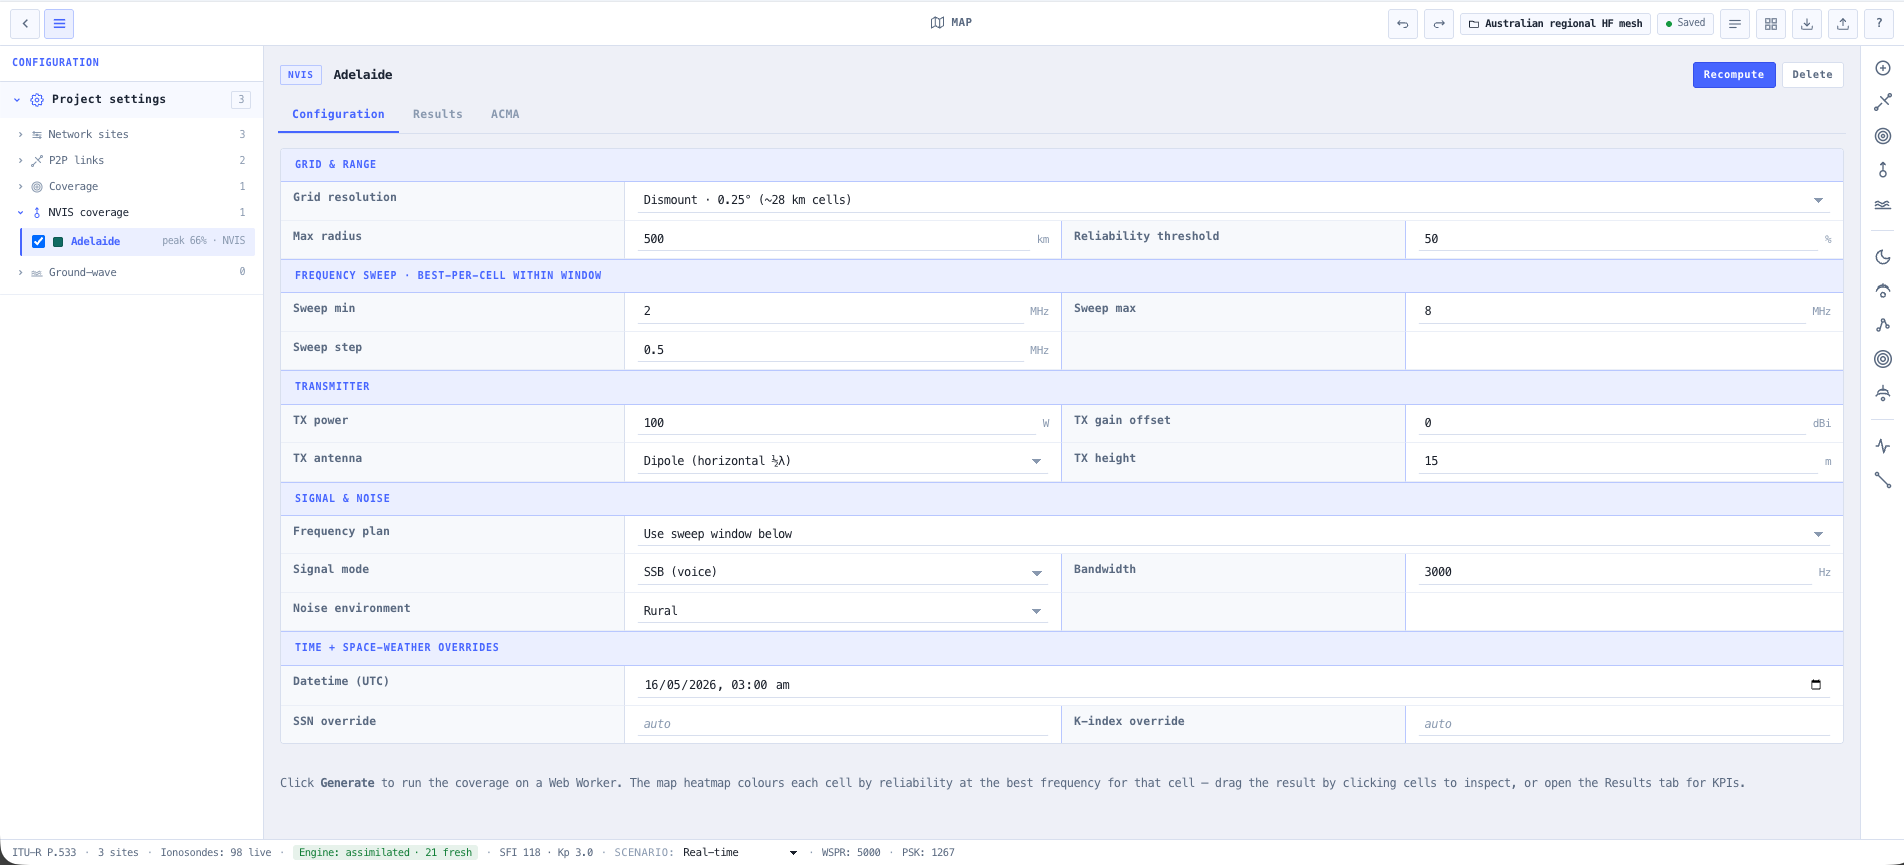
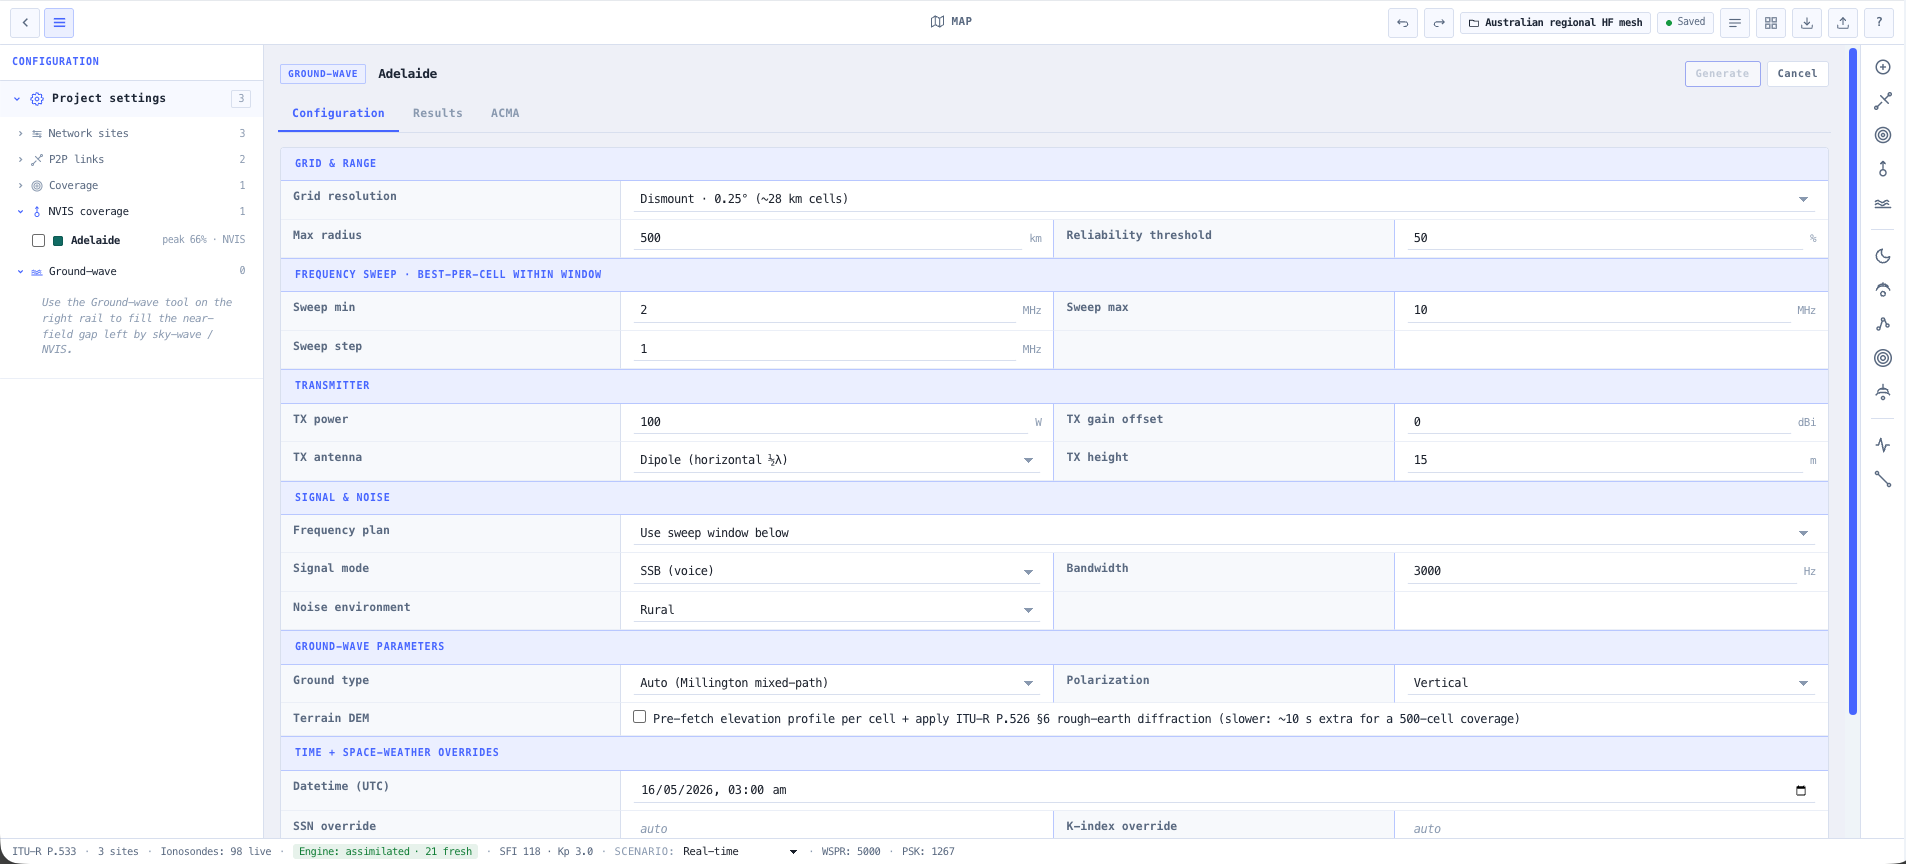
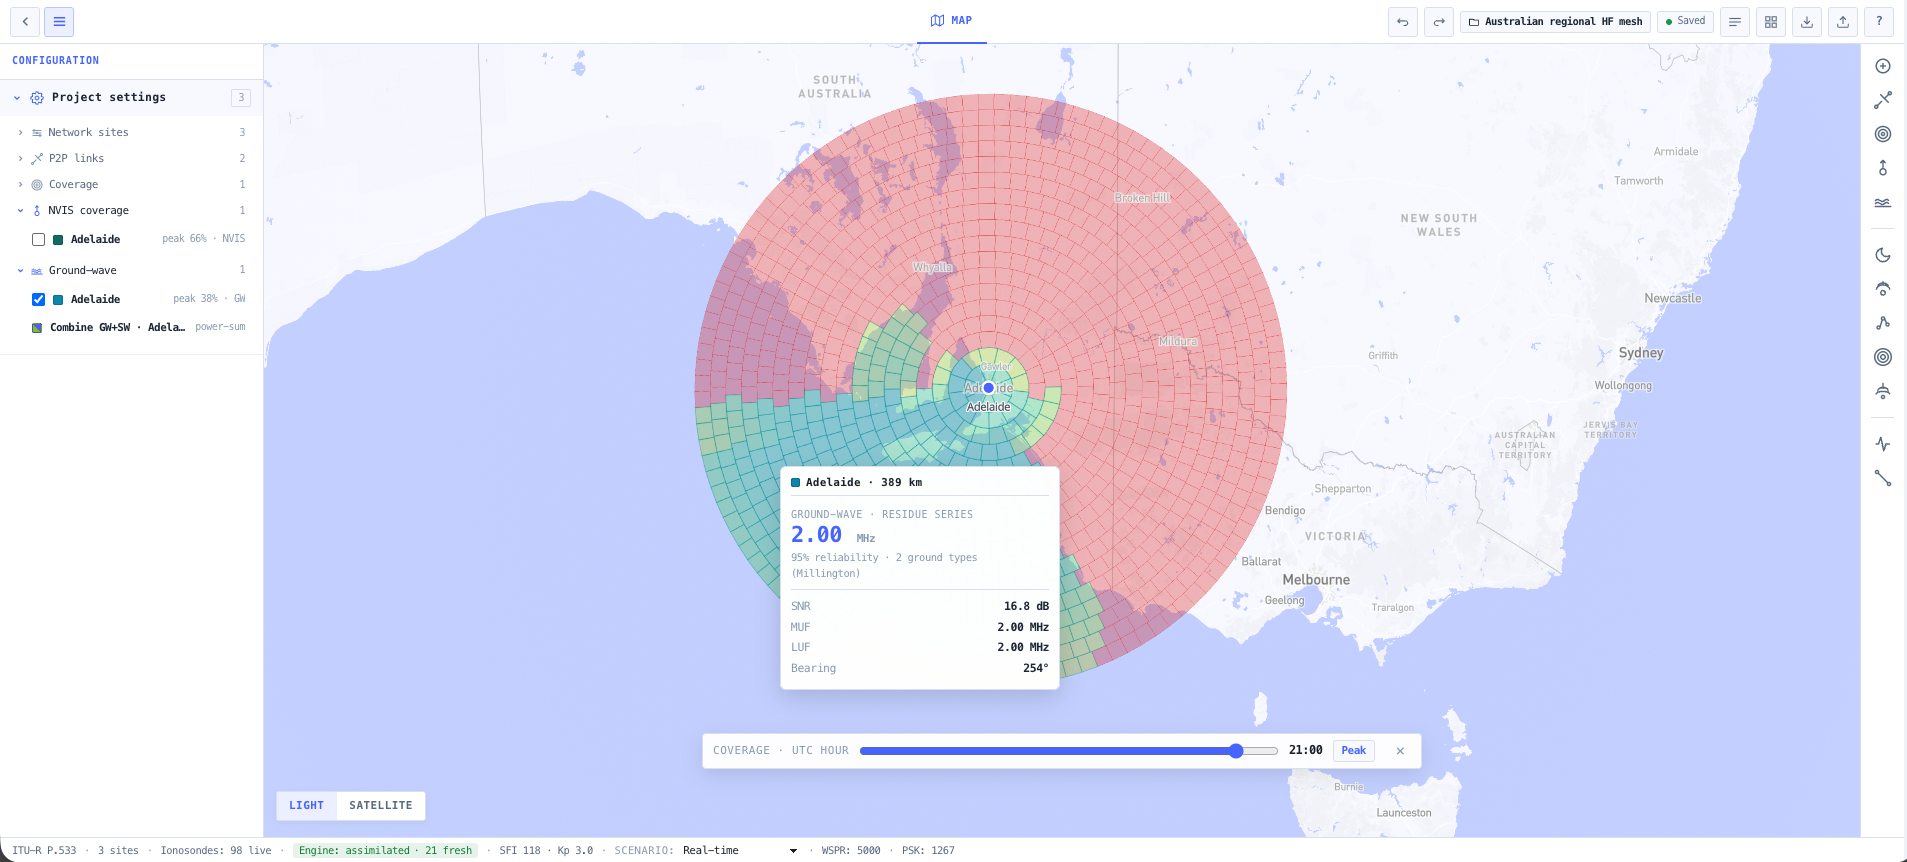
Point to multipoint coverage

Drop a single transmit site and generate an area coverage map showing reliability and field strength across every bearing and range. Configure operating frequency, TX power, antenna type, and take off angle, then overlay predicted coverage on the globe with legend and statistics.

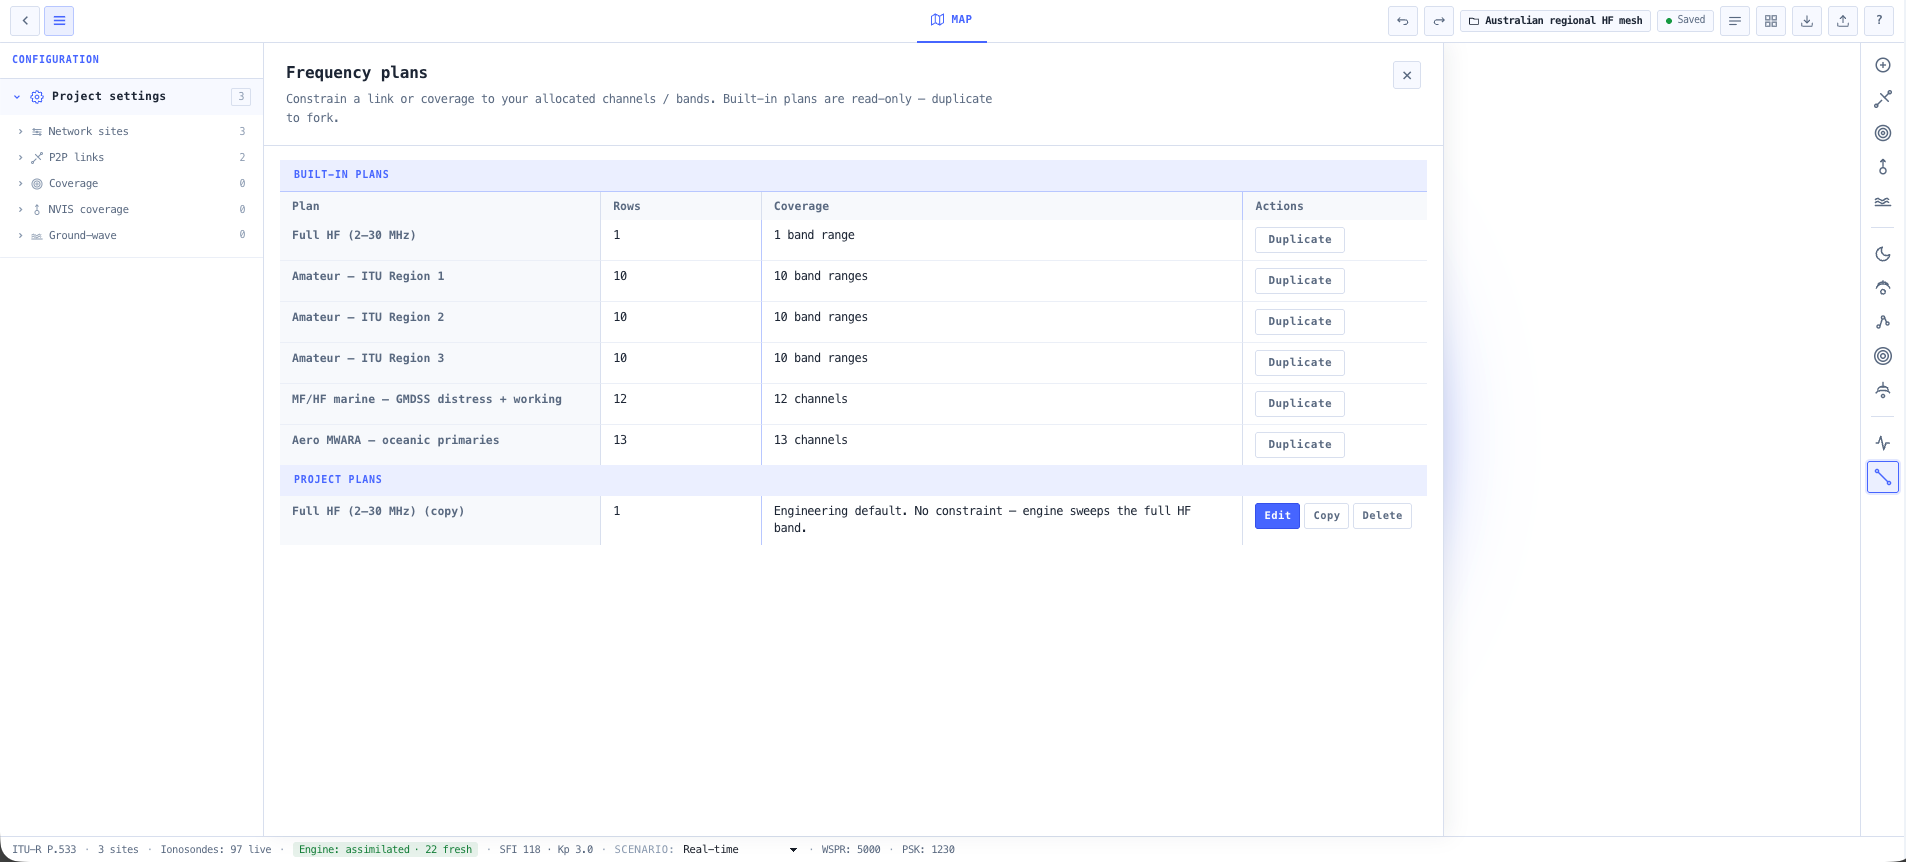
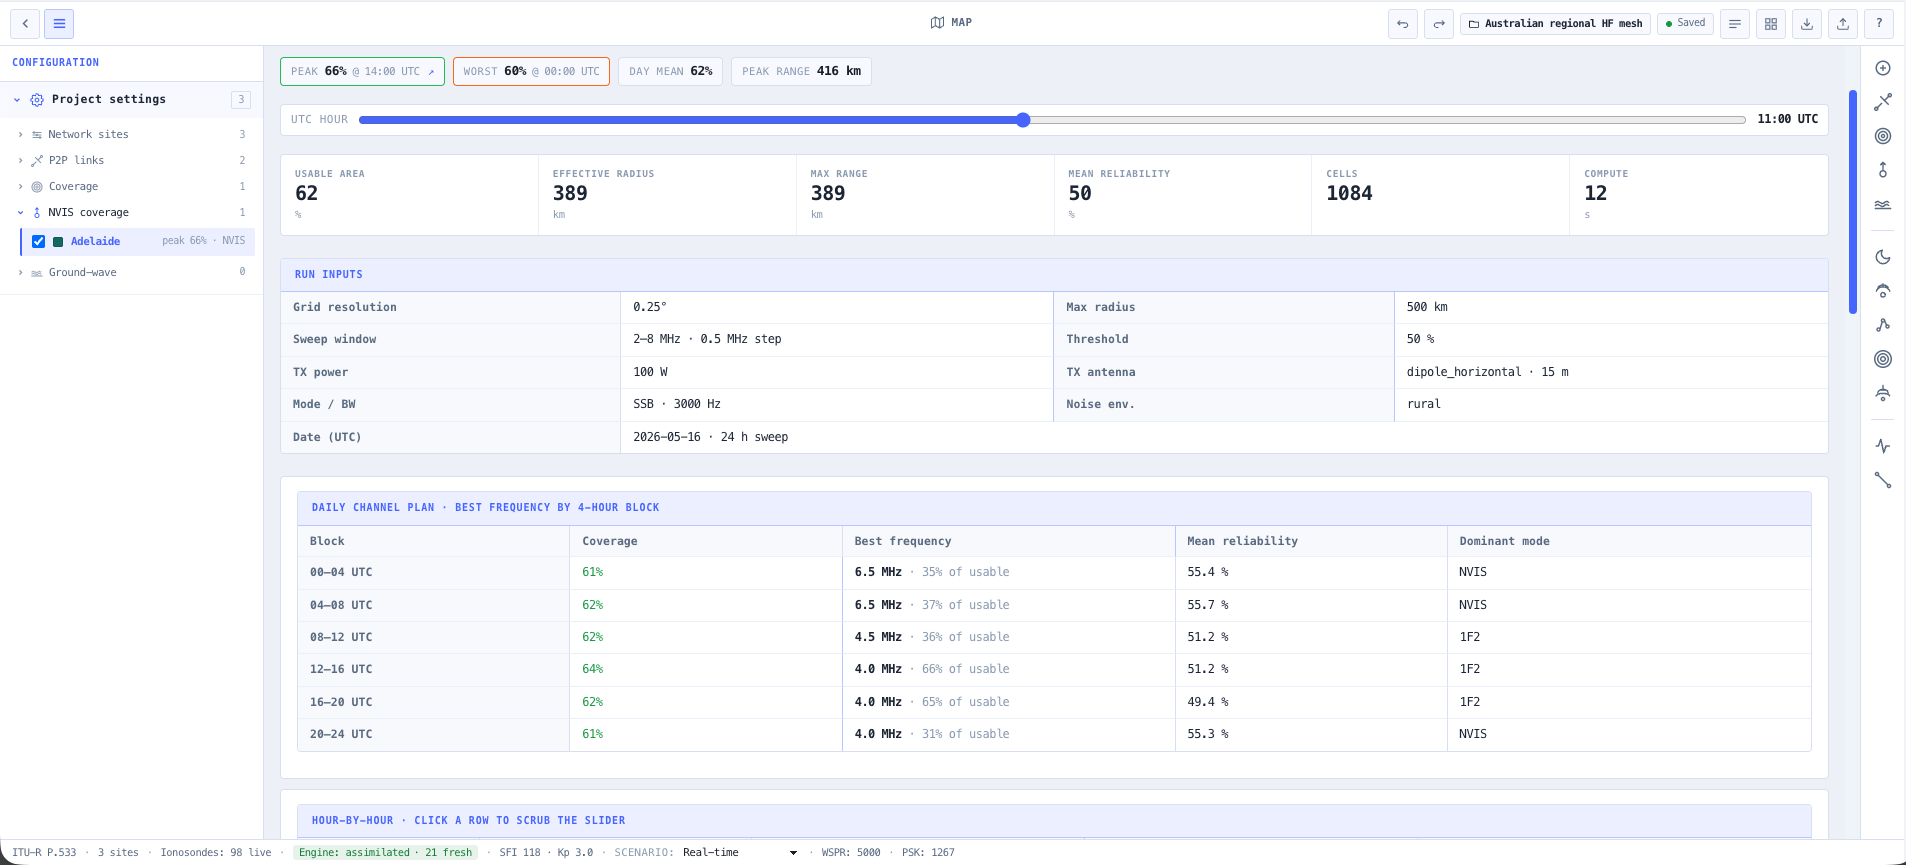
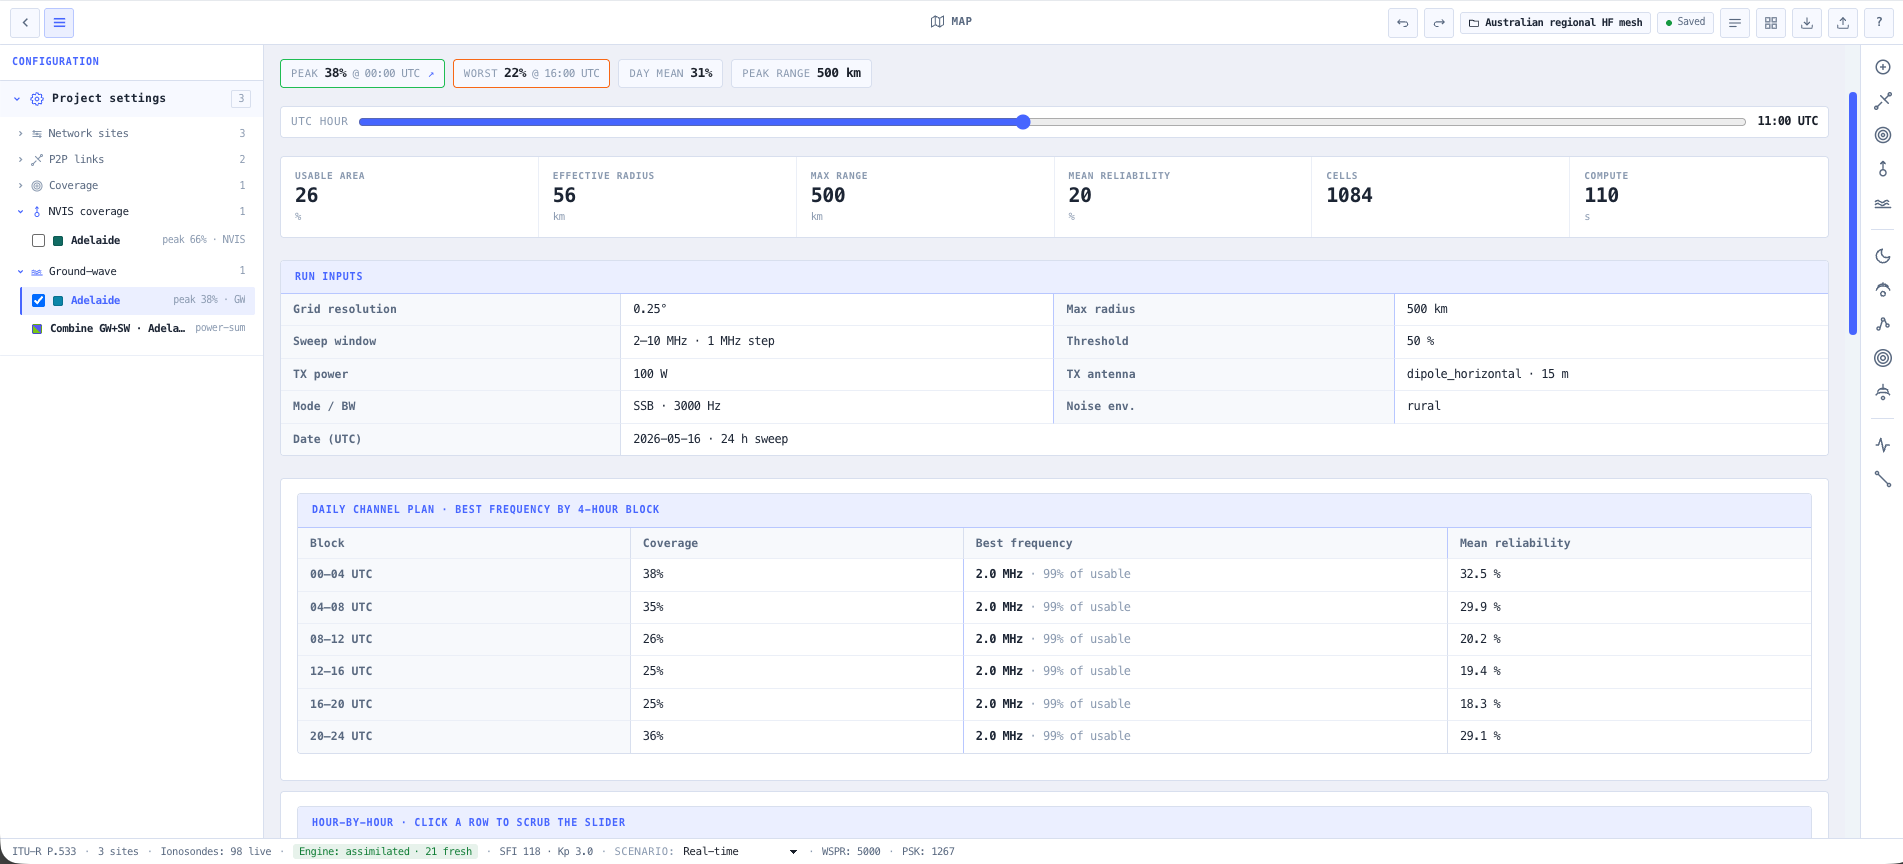
Ranked frequency recommendations

Rather than raw propagation tables, the planner scores usable frequencies across 2 to 30 MHz against your circuit requirements. Each candidate is evaluated for MUF margin, predicted field strength, SNR, absorption, reliability, and time availability, producing an actionable priority list with FOT, MUF, and LUF context.

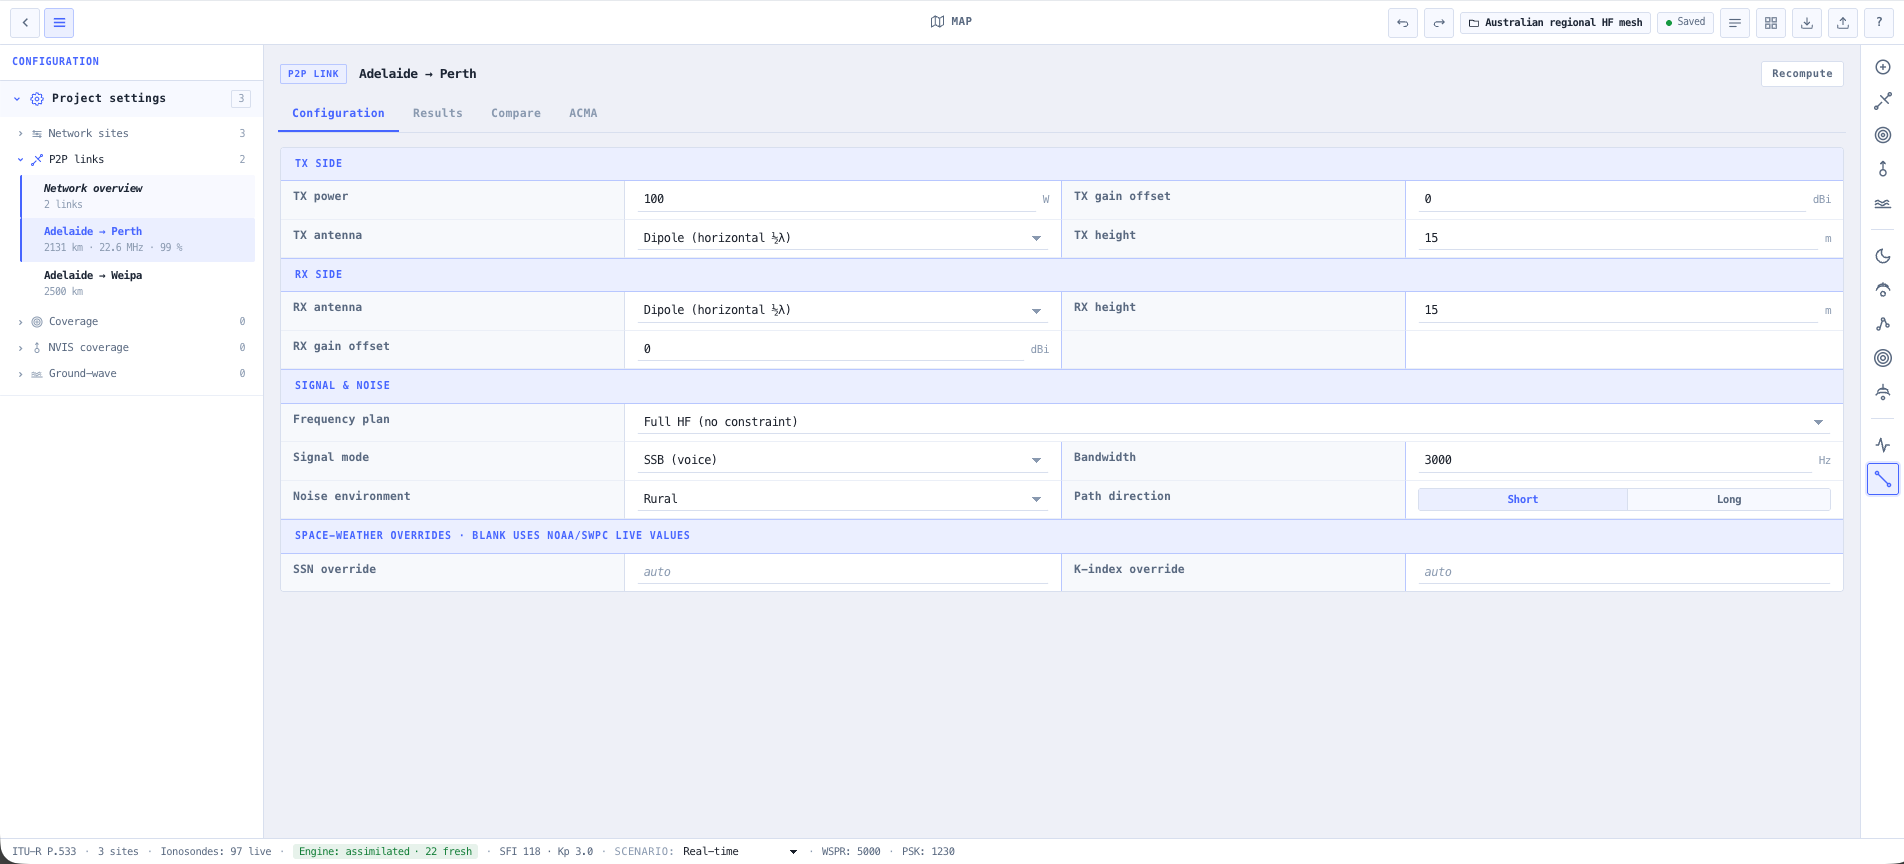
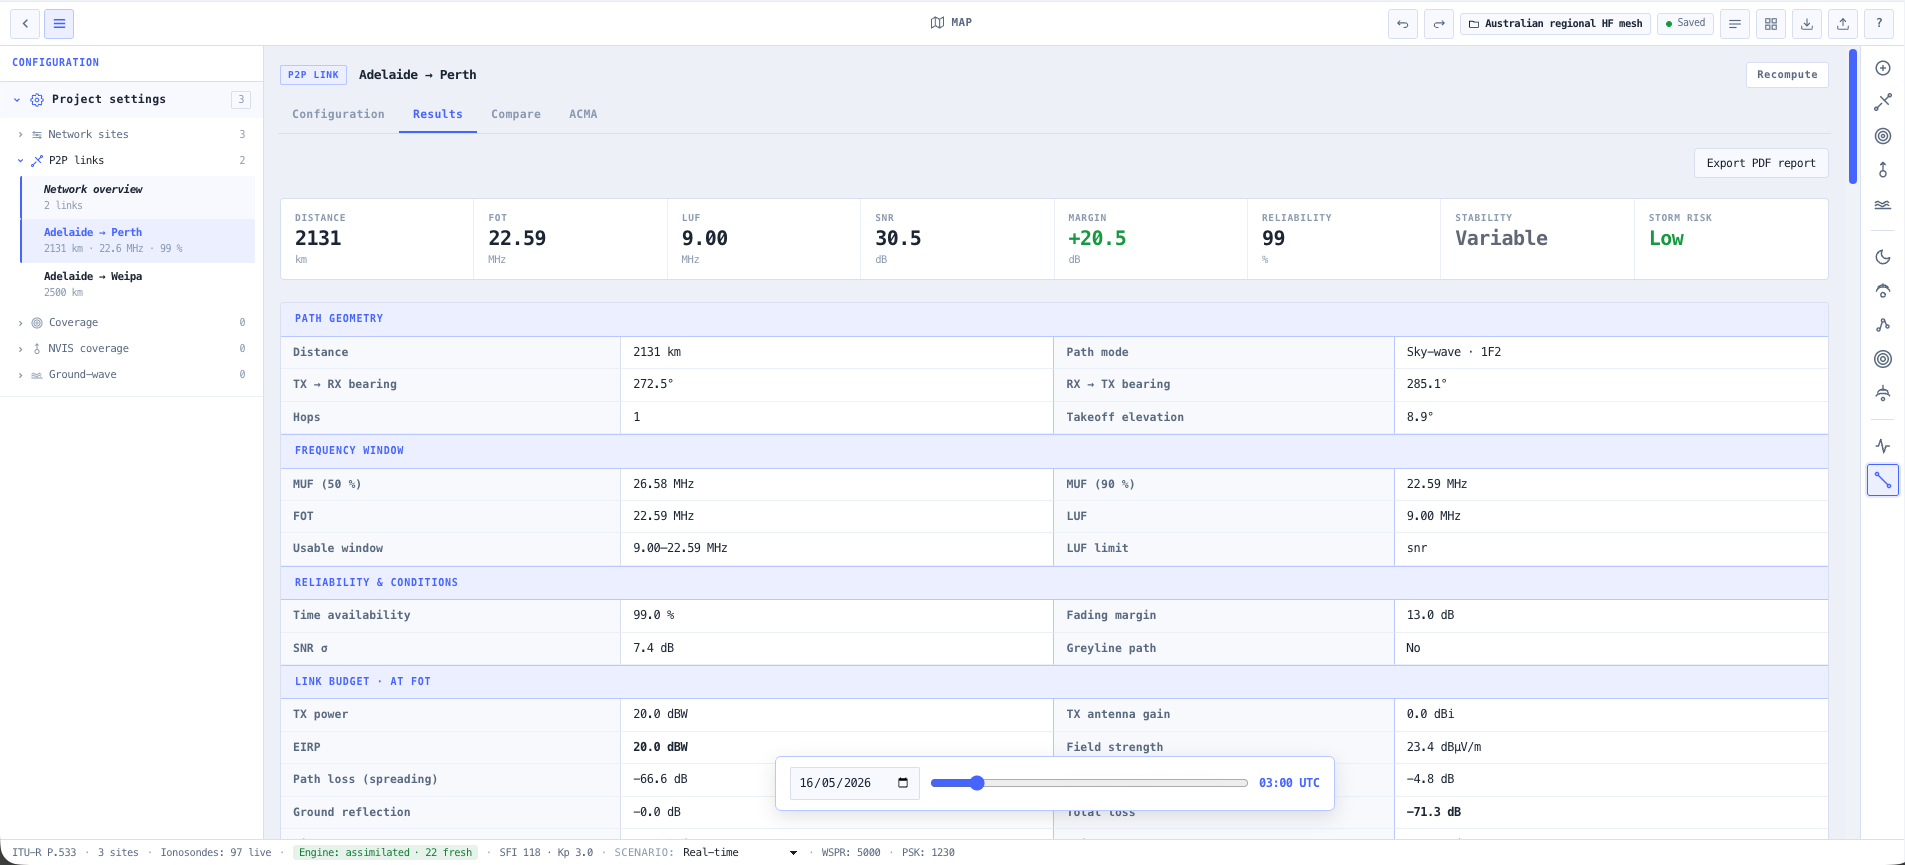
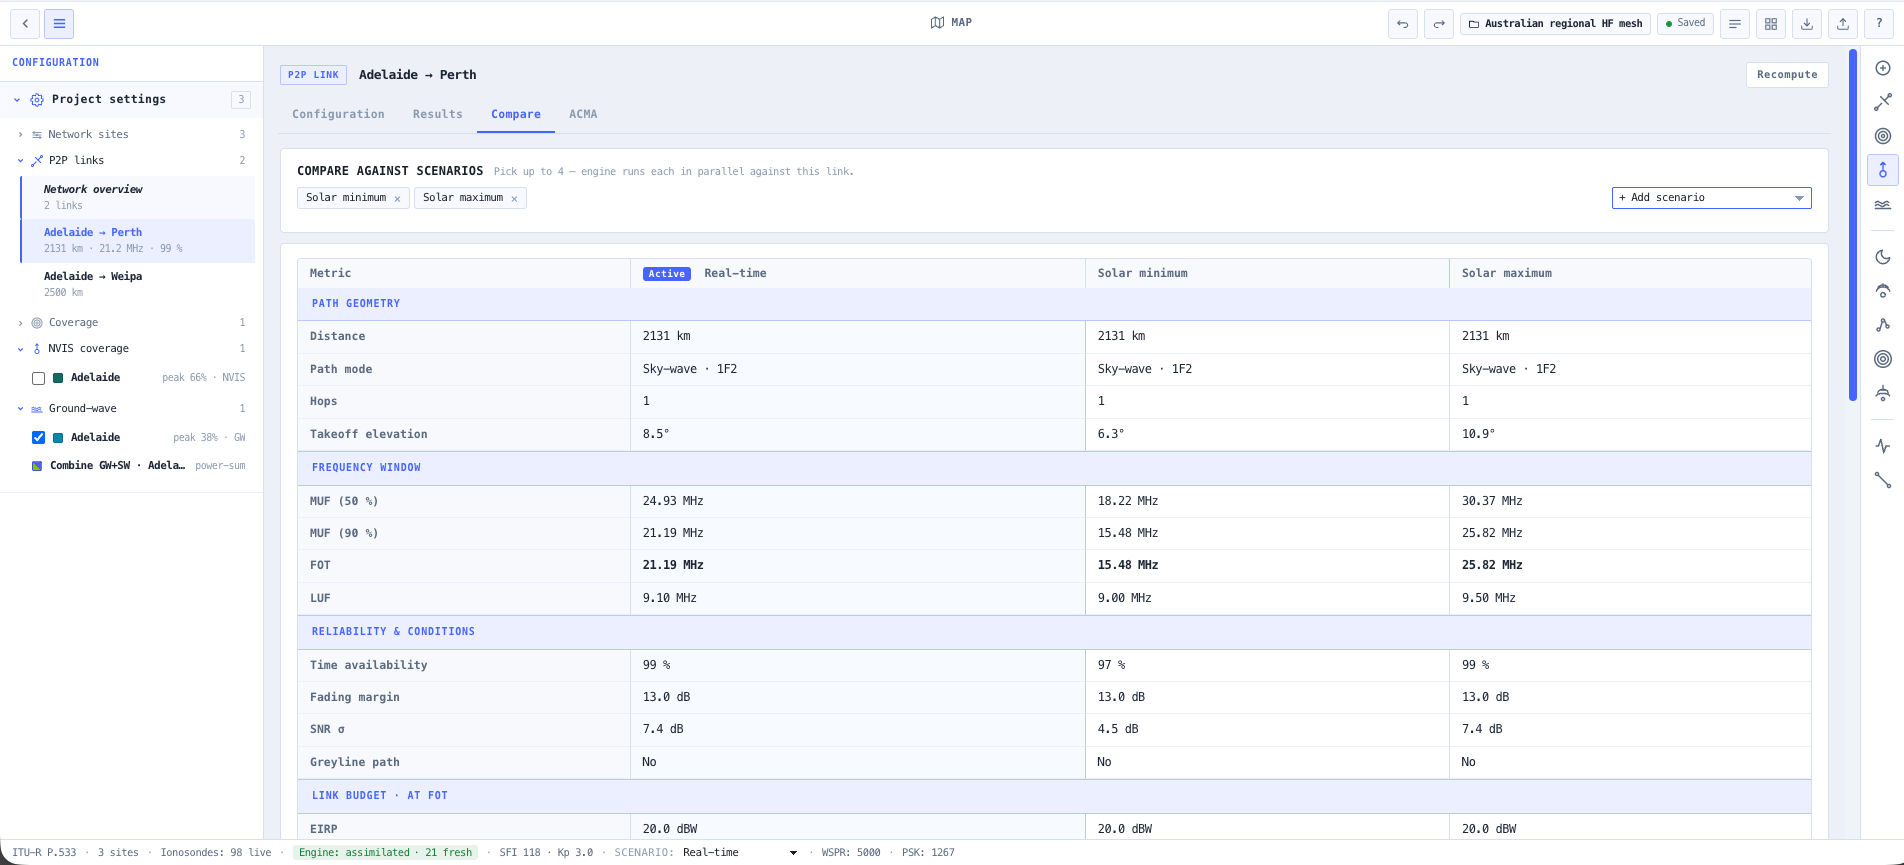
Complete link budget and noise

Full link budget at the FOT covering TX power, antenna gains, path loss, absorption, field strength, received power, and SNR. P.372 noise breakdown identifies the dominant external noise contributor (atmospheric, galactic, or man made) at the receive site for the selected hour and season.

MUF, LUF, and time of day charts

Dedicated charts plot MUF, LUF, and OWF envelopes for the chosen path together with 24 hour daily prediction curves and monthly variation, so operators can pick the window where the band is genuinely open. Statistical reliability is expressed as time availability consistent with ITU methodology.

Ionospheric layer diagnostics

A 2D path profile view renders hop geometry against F2 and E layer heights at the midpoint, with foF2, foE, M(3000)F2, and reflection height reported directly. Solar geometry (zenith angle at TX, midpoint, and RX, plus grey line proximity) is computed for the selected UTC hour.

Antenna pattern library

Elevation pattern models for common HF antennas (dipole, inverted V, vertical, log periodic, rhombic, Yagi, and broadband) are applied to both ends of the link, so predicted take off angle is matched to actual antenna response rather than assumed isotropic gain.

Live space weather conditioning

F10.7 solar flux, sunspot number, and Kp pulled from BOM SWS and NOAA SWPC condition every prediction. Disturbed ionosphere warnings flag when geomagnetic activity would degrade circuit performance.

ACMA site integration

Search the ACMA RadCom database by licence or callsign to populate TX and RX coordinates directly from registered Australian transmitters, eliminating manual entry errors and accelerating coordination workflows.

Standards & methodology

  • ITU P.533. HF sky wave propagation prediction
  • ITU P.1239. CCIR ionospheric maps and reference ionosphere
  • ITU P.372. Radio noise (atmospheric, galactic, and man made)
  • ITU P.531. Ionospheric propagation effects and D layer absorption
  • ACMA RadCom database integration for Australian licensed sites

When to use this tool

  • Selecting operating frequencies for a new HF voice or data circuit
  • Validating an existing HF link against current ionospheric conditions
  • Generating point to multipoint coverage maps for regional or national HF networks
  • Planning backup HF communications for emergency, defence, or remote operations
  • Producing link budget and reliability analysis for HF licence applications
  • Time of day and seasonal operating window selection for mission scheduling
  • Teaching HF propagation fundamentals with live, interactive model results
  • Coordinating HF channel sets across multi site or fleet deployments
  • Producing engineering documentation for ACMA HF licence renewal or variation
  • Diagnosing why an existing HF circuit is failing during disturbed ionospheric conditions
  • Comparing antenna and take off angle options against propagation predictions
  • Planning HF networks for resource sector, pastoral, and remote area operations

Is this the right tool for you?

Reach for the HF Link Planner in any of the following situations.

  • You are commissioning a new HF voice or data circuit and need to choose operating frequencies that will actually be open between your two sites at the times you need to operate.
  • You are responsible for an emergency services or defence HF network and need a defensible prediction of which frequency will work tonight, tomorrow, and next month.
  • You are running a remote operation, station, or vessel that depends on HF for primary or backup comms and need to know which channels to program before you leave coverage.
  • You are designing a regional or national HF broadcast or data coverage zone and need a point to multipoint coverage map showing where reliable reception is achievable.
  • You are seeing an existing HF circuit fail intermittently and want to confirm whether the problem is propagation, antenna, or terminal equipment.
  • You are preparing an ACMA HF licence application or variation and need traceable engineering output for the channel choices on the form.
  • You are scheduling a mission, exercise, or scientific campaign and need to identify the time window when the chosen path is most reliable.
  • You are evaluating antenna options (for example dipole versus broadband versus log periodic) and want predictions that reflect the actual elevation pattern of each candidate.
  • You are planning during a geomagnetic storm or solar event and need to understand whether the ionosphere is currently degraded enough to abandon the circuit.
  • You are training new HF operators or RF engineers and want a live, interactive teaching environment that surfaces MUF, LUF, absorption, and noise visually.
  • You are coordinating an HF channel set across a contractor radio fleet or pastoral network and need a single ranked recommendation list everyone can work from.
  • You are validating a frequency plan proposed by a vendor or consultant and want an independent ITU P.533 second opinion before signoff.
  • You are operating from an ACMA licensed site and want to populate coordinates and antenna detail directly from the RadCom database rather than transcribing them.
  • You are teaching or learning HF propagation and want a tool that explains MUF, LUF, OWF, FOT, grey line, and ionospheric layers in the context of a real circuit.

Frequently asked questions

Which propagation standard does the planner use?

It is a complete implementation of ITU Recommendation P.533, the international standard for HF sky wave propagation prediction. P.533 is supported by P.1239 CCIR ionospheric maps, P.372 for radio noise, and P.531 for D layer absorption. All four are evaluated on every prediction.

What is the difference between MUF, LUF, OWF, and FOT?

MUF is the Maximum Usable Frequency, the highest frequency the ionosphere will support for the path at the chosen hour. LUF is the Lowest Usable Frequency, set by absorption and noise. OWF (Optimum Working Frequency) and FOT (Frequency of Optimum Traffic) sit between MUF and LUF and represent the most reliable working frequency. The planner shows all four together so you can pick a frequency with margin on both ends.

How is space weather incorporated?

F10.7 solar flux, sunspot number, and Kp are pulled live from BOM Space Weather Services and NOAA SWPC and applied to the ionospheric model on every prediction. When geomagnetic activity is high enough to degrade circuit performance, the planner surfaces a disturbed ionosphere warning so you do not commit a plan to a band that is currently impaired.

Can it generate area coverage maps for a single transmitter?

Yes. Drop a single transmit site, choose operating frequency, TX power, antenna, and take off angle, and the engine generates a point to multipoint coverage map across the surrounding region. Reliability and field strength are overlaid on the globe with a legend and coverage statistics.

Does it use ACMA site data?

Yes. You can search the ACMA RadCom database by licence or callsign and populate TX or RX coordinates directly from registered Australian transmitters, which removes a class of manual entry errors and makes coordination, licence application, and validation work considerably faster.

What antennas are modelled?

Elevation pattern models for dipole, inverted V, vertical, log periodic, rhombic, Yagi, and broadband HF antennas are applied to both ends of the link. The predicted take off angle is matched to the actual antenna response, rather than assuming isotropic gain.

Does the planner produce a complete link budget?

Yes. At the FOT, the planner returns TX power, antenna gains at each end, free space and ionospheric path losses, D layer absorption, field strength in dBμV/m, received power, SNR, and the SNR margin against your required grade of service. The P.372 noise breakdown identifies the dominant external noise source for the receive site at the selected hour and season.

Can I see how the band varies through the day or across the year?

Yes. Daily 24 hour prediction curves show MUF, LUF, and reliability hour by hour. Monthly view extends that across the year so you can see seasonal variation. Together they let you select the time window where the path is most reliable for a given mission or scheduled traffic.