Design optical networks on a canvas, from FTTH access to DWDM long haul, with a bidirectional link budget, WDM wavelength routing, OSNR and dispersion budgets, PON class checks and modelled OTDR traces.
Included in the 14-day Pro trial on every new account. No credit card.
Fibre Optic System Designer
10 inputs→9 outputs
Walkthrough
See it working
Fibre Optic System Designer1 / 5
Start from a template or a blank canvas.
Overview
What the Fibre Optic System Designer does
A fibre project depends on its link budget, and the budget is where errors hide. Every connectorised node adds loss, every span adds attenuation and chromatic dispersion, every splitter or demultiplexer divides the power, and every amplifier in a long haul chain adds noise that erodes OSNR. In a spreadsheet, the upstream direction of a PON, the wavelength routing through WDM equipment and the PON budget class each become separate exercises that drift out of step with the design.
Read the full overview
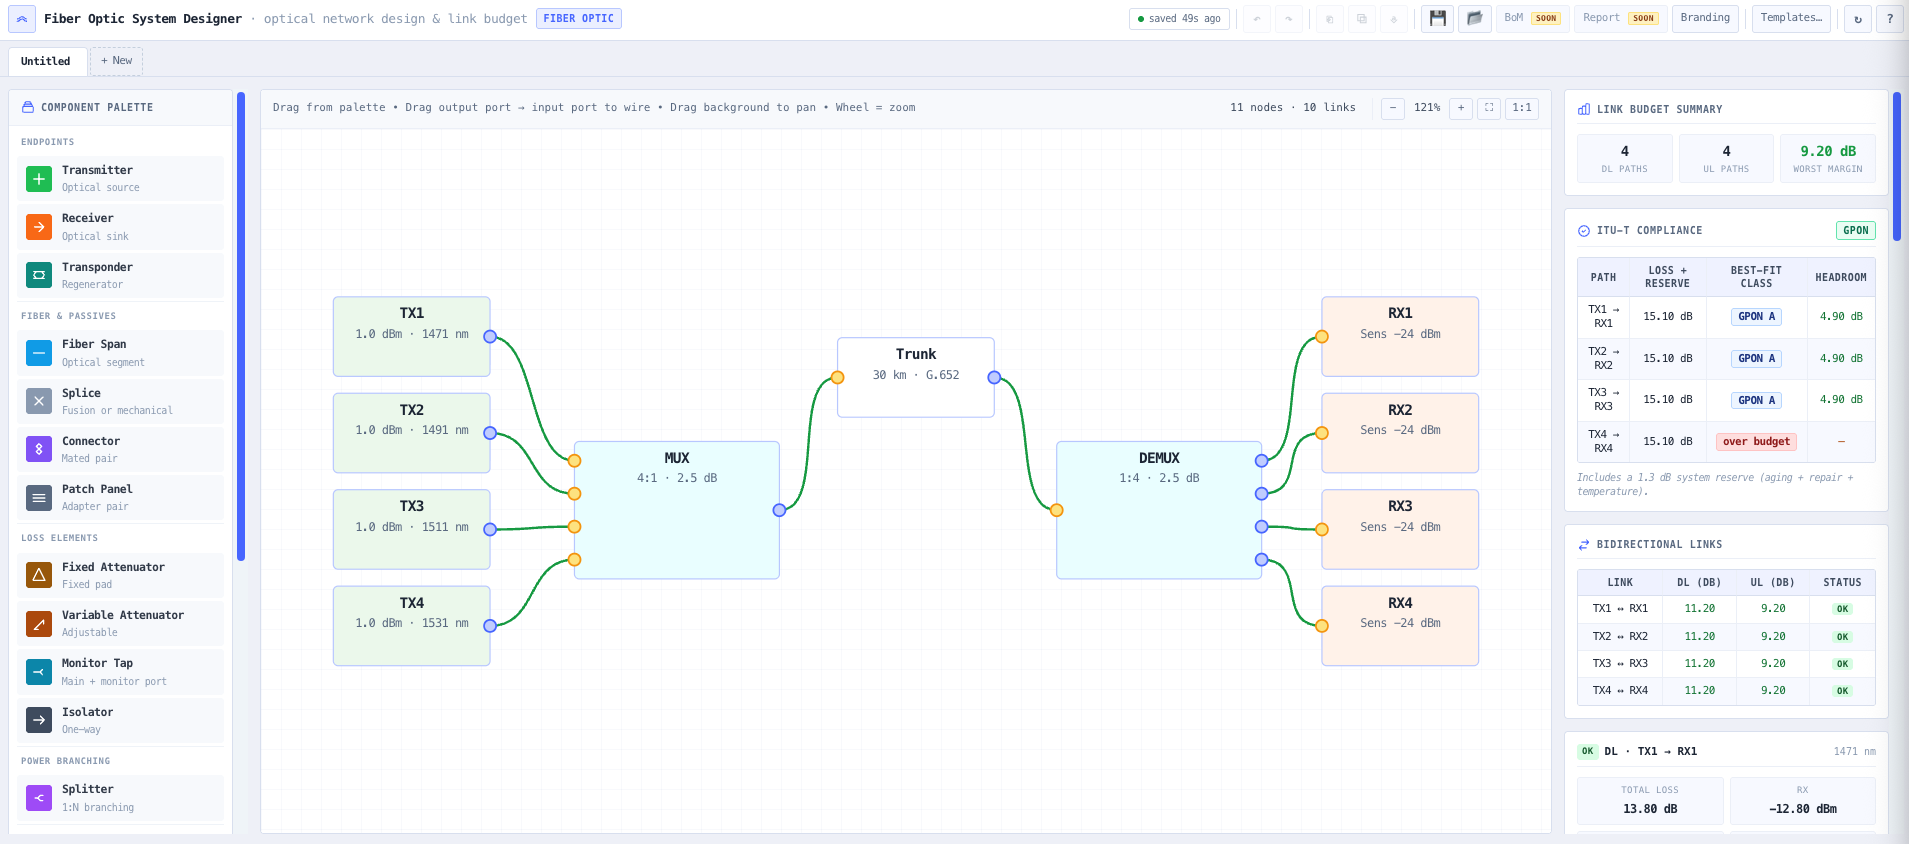
The designer puts the whole optical layer on one canvas. Drag components from a palette onto a node graph, wire output ports to input ports, and the link budget is recalculated on every change. Each fan-out is treated as its own path, so every transmitter and receiver pair has its own hop by hop breakdown of loss, received power, margin against sensitivity and overload, OSNR and accumulated dispersion. A reverse pass gives the upstream margin beside the downstream one.
WDM components are wavelength aware, so a signal wired to the wrong multiplexer port is blocked and flagged rather than counted. Links with PON optics are matched in both directions to the ITU-T GPON, XG-PON, XGS-PON and NG-PON2 loss classes with a system reserve, and a validation check flags issues such as connector polish mismatches, wavelengths outside the fibre band, amplifier saturation and receiver overload. A modelled OTDR trace from any node shows the events a technician should expect to see along the fibre.
Capabilities 8
Node graph canvas and templates
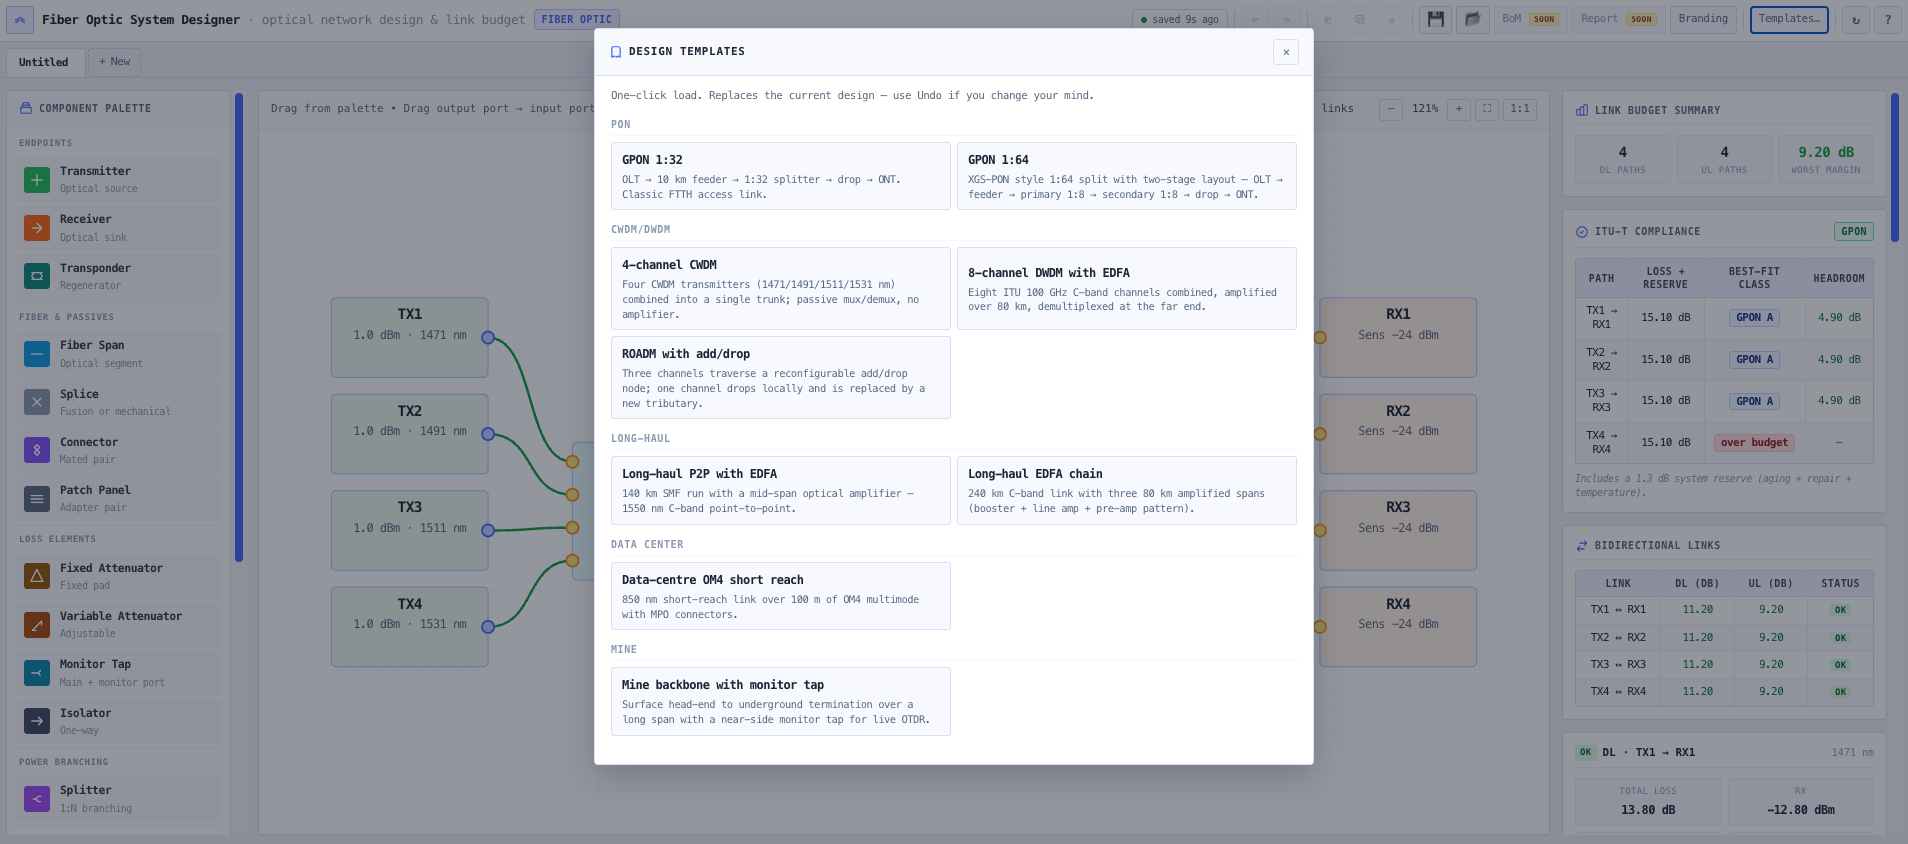
Lay out transmitters, receivers, transponders, fibre spans, splices, connectors, patch panels, attenuators, taps, isolators, splitters, WDM equipment and optical amplifiers, and wire them port to port. Templates for common designs, such as GPON, CWDM, DWDM, ROADM and amplified long haul links, give you a quick starting point.
Bidirectional link budget
Every transmitter to receiver path is traced with port specific losses, including equipment pigtail and fibre termination losses, and reports total loss, received power, margin, OSNR and dispersion with a hop by hop breakdown. Upstream paths run from each receiver's return transmitter, so downstream and upstream margins can be read side by side.
WDM wavelength routing
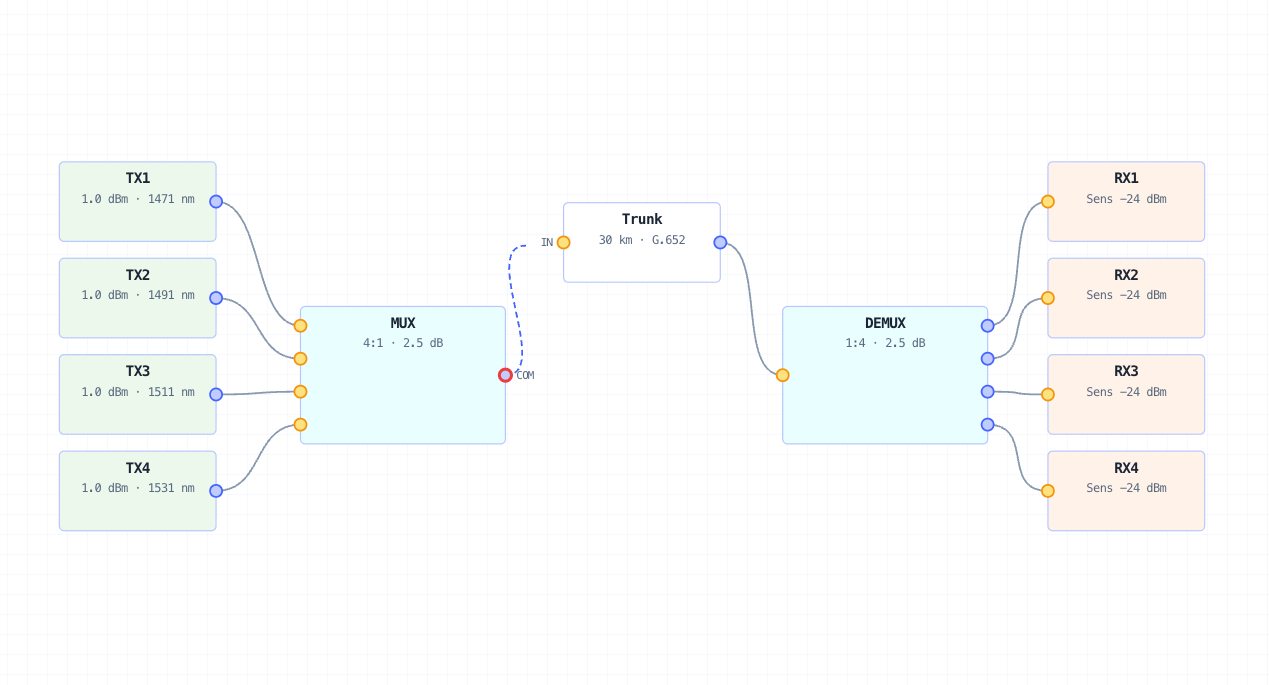
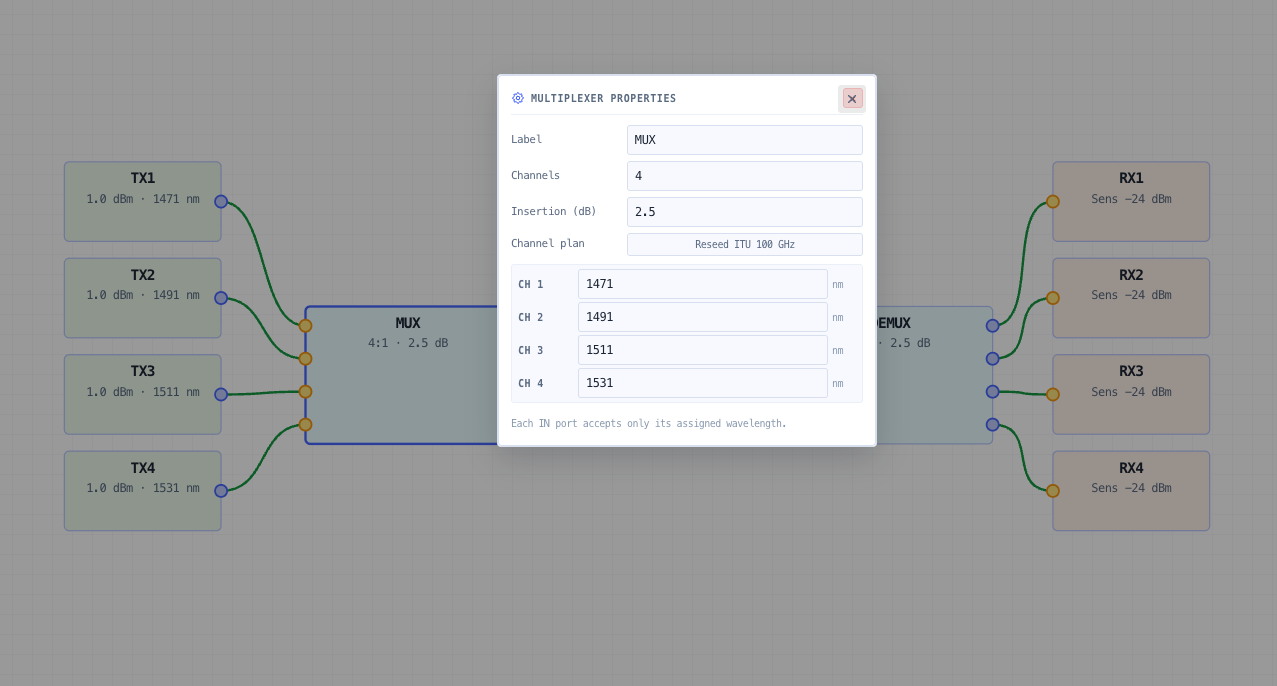
Multiplexers, demultiplexers, add/drop nodes, ROADMs and channel filters route on the path wavelength against a per-port channel plan based on the ITU-T 100 GHz grid. A transmitter on the wrong wavelength for its port is blocked and flagged.
ITU-T PON budget class check
Each downstream and upstream path of a link with PON optics is matched to the smallest ITU-T G.984 GPON, G.987 XG-PON, G.9807 XGS-PON or G.989 NG-PON2 class that covers its maximum loss plus a system reserve for ageing, repair and temperature, and its worst-case lowest loss is checked against the class minimum. The headroom is shown for each path.
OSNR and dispersion budgets
Optical amplifiers add ASE noise based on their gain and noise figure, so OSNR is tracked through amplifier chains to each receiver. Chromatic dispersion accumulates along each span and can be offset by a dispersion compensator, and both are checked against the receiver's tolerance when one is set.
Validation as you design
A continuous check flags issues by severity, including connector polish mismatches, wavelengths outside the fibre's band, measured attenuation above the ITU-T G.652.D maximum, amplifier saturation, splitter starvation, receiver overload, and OSNR or dispersion limits exceeded. Each issue explains what is wrong.
Modelled OTDR traces
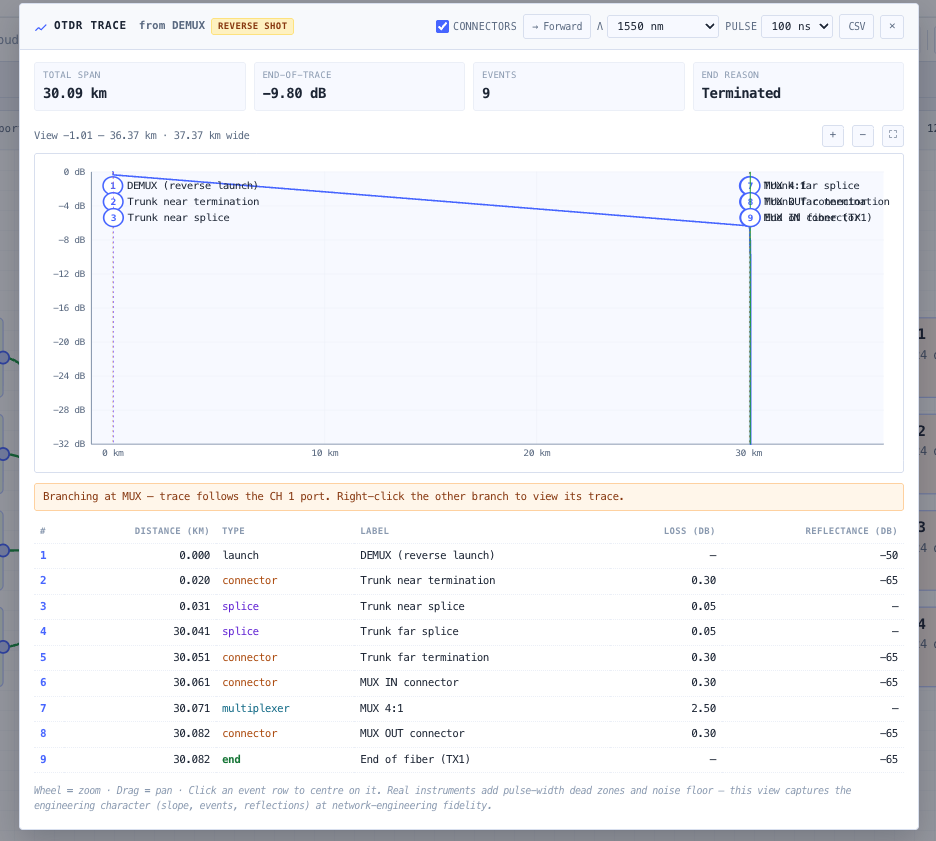
Open an OTDR trace from any node to see fibre slopes, splice and component losses and connector reflections along the path, at a choice of pulse width and test wavelength. The event table exports to CSV, and the trace is a modelled view that does not include instrument dead zones or noise.
Projects that save themselves
Keep several designs side by side in one project, each with its own undo history. Your work saves automatically in your browser and to your noIM₃ account.
Inputs and outputs
What goes in, what comes out
Inputs 10
Transmitter launch power and wavelength
Receiver sensitivity and overload, with optional OSNR and dispersion tolerance
Optional return transmitter power and wavelength for upstream analysis
Fibre span type, length, attenuation, dispersion coefficient and termination loss
Splice, connector and patch panel losses, with connector polish
Splitter ratio and insertion loss
Multiplexer, demultiplexer, add/drop and ROADM channel plans
Optical amplifier gain, maximum output and noise figure
Attenuator, monitor tap and isolator settings
Connections between components on the node graph
Outputs 9
Total loss, received power and margin for every path
Downstream and upstream margin for each link
Hop by hop loss and power along each path
OSNR at each receiver
Accumulated chromatic dispersion
Best fit ITU-T PON budget class and headroom for each path
Worst margin across the design
Validation issues grouped by severity
Modelled OTDR trace from any node, with an event table exportable to CSV
Standards & methodology
ITU-T G.984 GPON budget classes
ITU-T G.987 XG-PON, G.9807 XGS-PON and G.989 NG-PON2 budget classes
ITU-T G.652 and G.657 single-mode fibre attenuation and dispersion
ITU-T G.671 splitter maximum and minimum insertion loss
ITU-T 100 GHz C-band channel grid for WDM channel plans
OSNR from amplifier ASE noise in a 0.1 nm reference bandwidth
Use cases
When to use this tool
01Designing an FTTH GPON access network and checking its budget class
02Checking whether existing GPON fibre and splitters will support XGS-PON
03Sizing splitter ratios and feeder lengths from the available headroom
04Verifying an amplified DWDM link for OSNR and chromatic dispersion
05Planning ROADM and add/drop channel routing on a multi-channel trunk
06Reviewing a vendor design against an independent link budget
07Preparing the expected OTDR events for an installation crew
08Planning a mine or industrial fibre backbone with a monitor tap
It traces every transmitter to receiver path and adds fibre attenuation, splice, connector and patch panel losses, splitter and WDM losses, and equipment pigtail and fibre termination losses. Each fan-out is its own path, so every transmitter and receiver pair has its own breakdown of loss, received power, margin, OSNR and dispersion.
How does the upstream analysis work?
Downstream paths start at transmitters and end at receivers. Upstream paths start at a receiver that has a return transmitter set, such as an ONT transmitting at 1310 nm in a GPON design, and run back towards the transmitter. Downstream and upstream margins are shown side by side, and isolators block the reverse direction.
Which ITU-T budget classes are checked?
Links whose transmitter is set to PON optics are matched in both directions against the classes of ITU-T G.984 GPON, G.987 XG-PON, G.9807 XGS-PON or G.989 NG-PON2. The tool adds a system reserve for ageing, repair and temperature, picks the smallest class that covers the path, shows the headroom and checks the worst-case lowest loss against the class minimum.
How is OSNR calculated?
Each optical amplifier adds ASE noise based on its gain and noise figure, referenced to a 0.1 nm bandwidth, and the running noise is carried along the path. OSNR at the receiver is the signal power less the accumulated noise. When a receiver has an OSNR requirement set, the tool warns as the margin gets small and flags an error below the requirement.
How close is the OTDR trace to a real instrument?
It is a modelled trace built from the design, showing fibre slopes, splice and component losses, connector reflections and the fibre end. It is useful for knowing which events to expect and where. It does not model instrument dead zones, polarisation or noise, so it will not match a field trace exactly.
How does the tool stop a wavelength going to the wrong port?
WDM components route on the path wavelength against a per-port channel plan. A transmitter wired to a port set for a different wavelength is blocked there and flagged in the validation list, rather than being counted as delivered.
Is my design saved?
Yes. Designs save automatically in your browser and are synced to your noIM₃ account, so they are there when you come back. A project can hold several designs side by side, each with its own undo history.