A UHF repeater takes a radio’s signal on one frequency and retransmits it on another from a high site, so that handhelds and vehicles that cannot hear each other directly can talk across a whole town or district. Designing one comes down to a short list of questions. Who carries the radios and where? Which site can see that area? Which frequency pair, duplexer, feeder and antenna? And does the system work in both directions, from the repeater to the radio and from the radio back to the repeater?
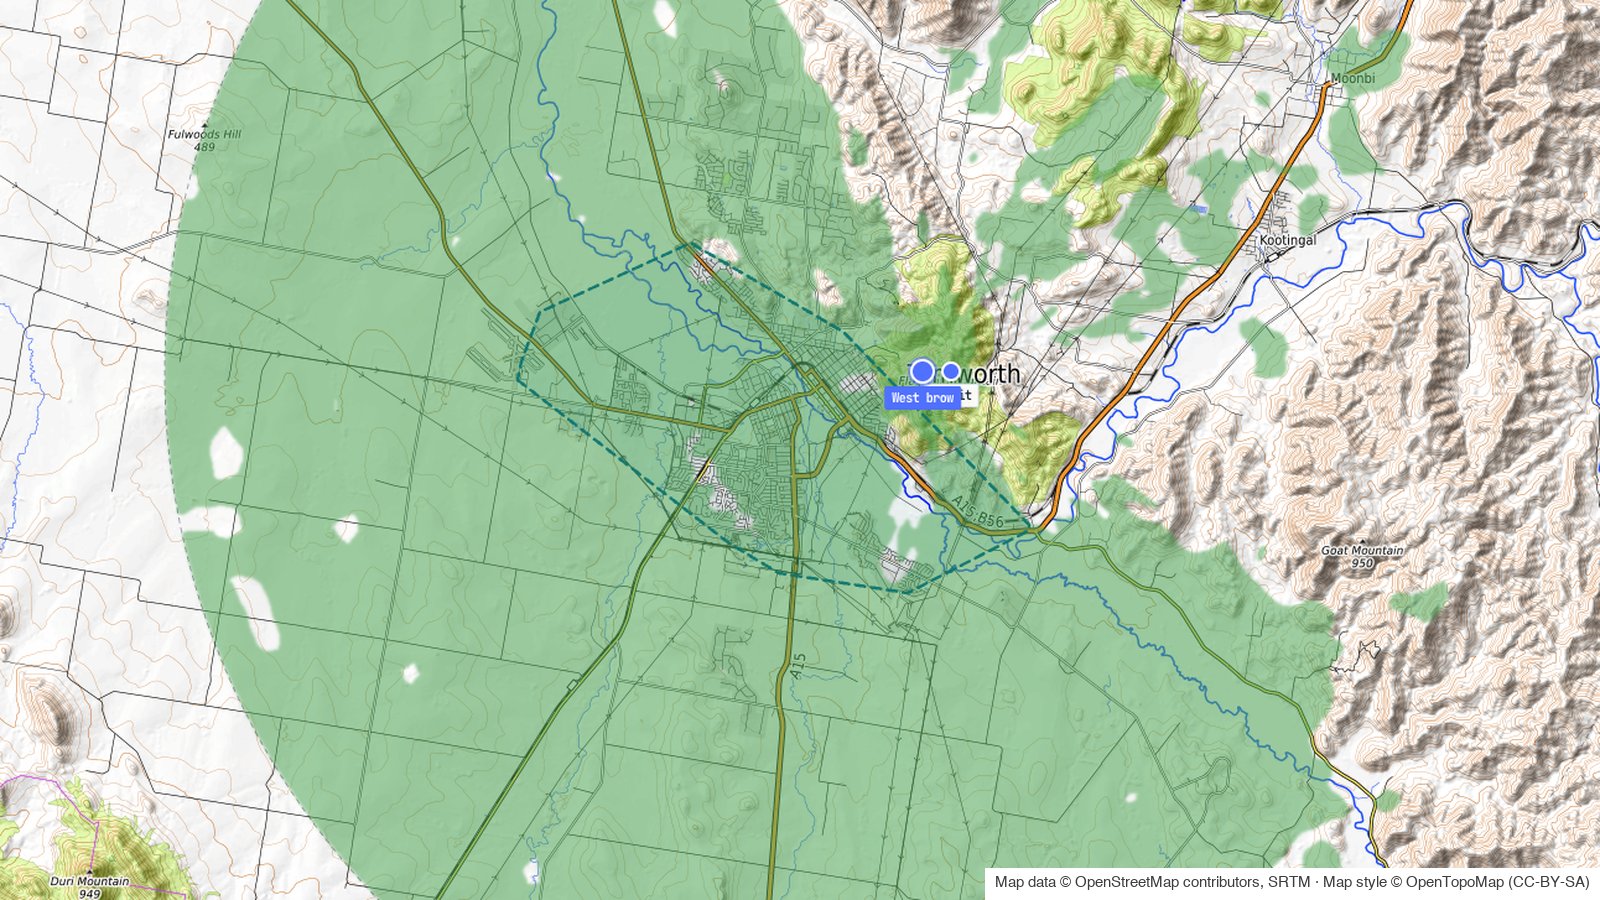
This guide answers those questions for a real place: the city of Tamworth in New South Wales, served from a hill about 450 m above the city centre. Every figure and screenshot comes from the noIM₃ Coverage Predictor, so you can follow along and change any input to see what moves.
The first attempt fails, and the reason it fails is the most useful part of the guide. The repeater reaches almost the whole city, but the handhelds cannot reach the repeater.
The Short Answer
To design a UHF repeater system, work in this order:
- Set the requirement: the area, the radio the users carry, where they wear it, the audio quality and the share of the area that must work.
- Choose a site that can see the area, not just the highest point nearby.
- Pick a duplex frequency pair from the band plan and a duplexer that suits the split.
- Build the transmit chain: repeater power, duplexer loss, feeder loss and antenna gain.
- Choose the antenna by its vertical pattern as well as its gain.
- Set the receiver and the coverage threshold from the audio quality you need, not the datasheet sensitivity.
- Choose a propagation model that follows the terrain.
- Predict talk-out and talk-back, and judge the design on the weaker of the two.
- Find out why the weak areas are weak, then fix the cause.
- Check the wider area, then plan the licence and export the design.
Here is how the example changed between the first attempt and the final design.
| First attempt | Final design | |
|---|---|---|
| Site | Summit, 833 m above sea level | West brow, 789 m, 750 m west of the summit |
| Mast | 30 m | 30 m |
| Antenna | ZCG G46 collinear, 8.15 dBi | ZCG G49 collinear, 11.15 dBi |
| EIRP | 51.3 dBm | 54.3 dBm |
| City covered, talk-out | 96.9 % | 99.2 % |
| City covered, talk-back | 73.5 % | 90.7 % |
| City covered, both directions | 73.5 % | 90.7 % |
| Target: 90 % both directions | Fails | Passes |
The Example
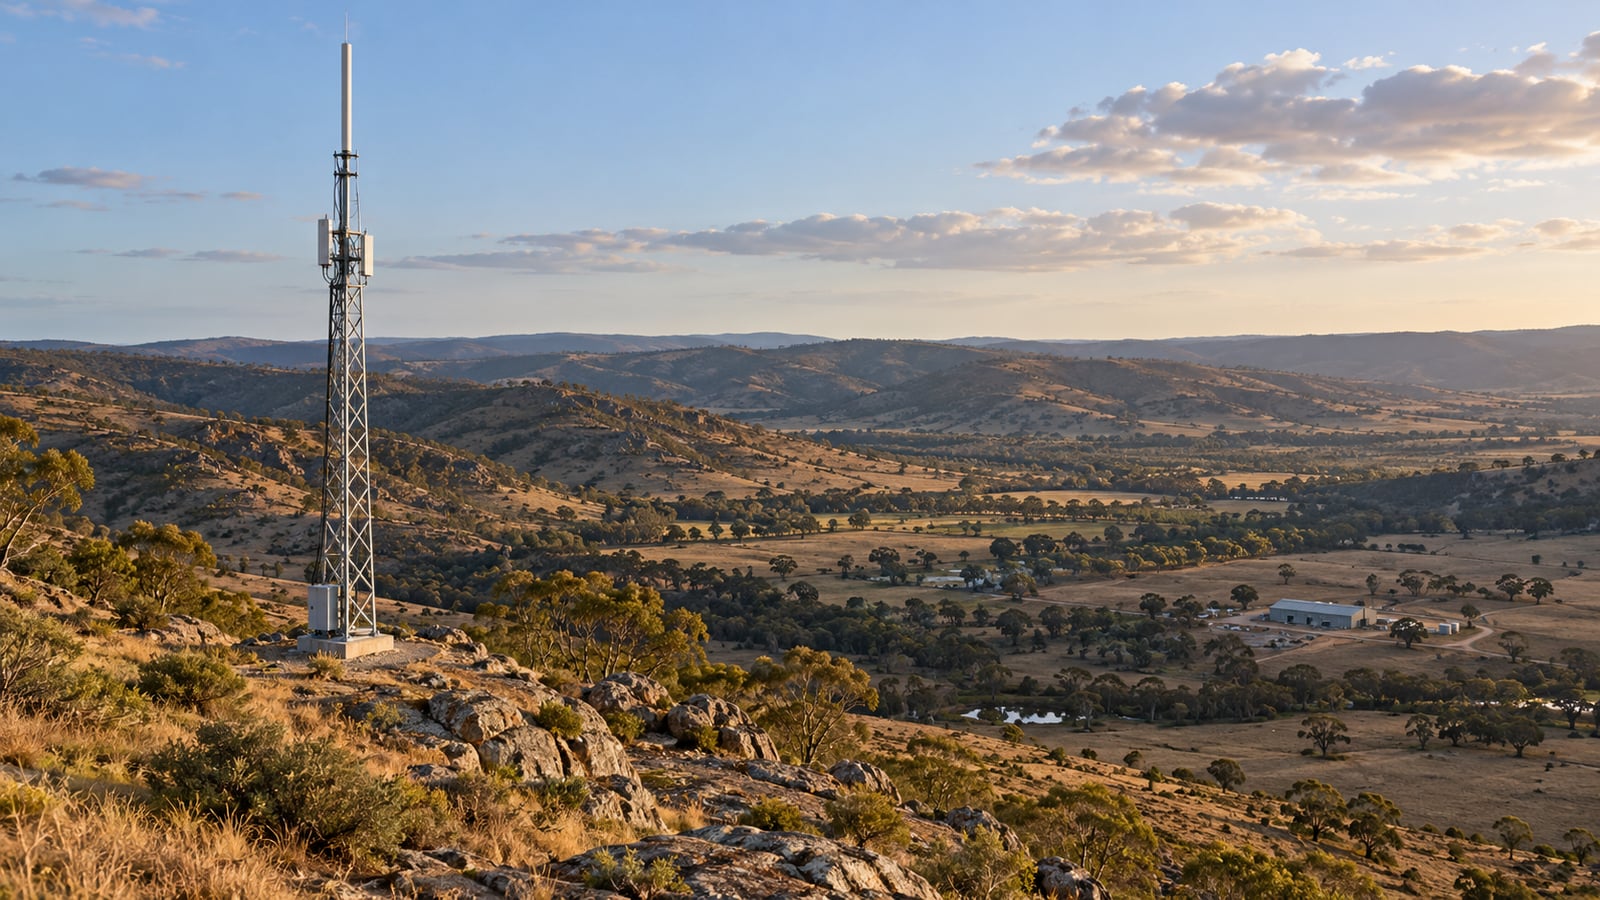
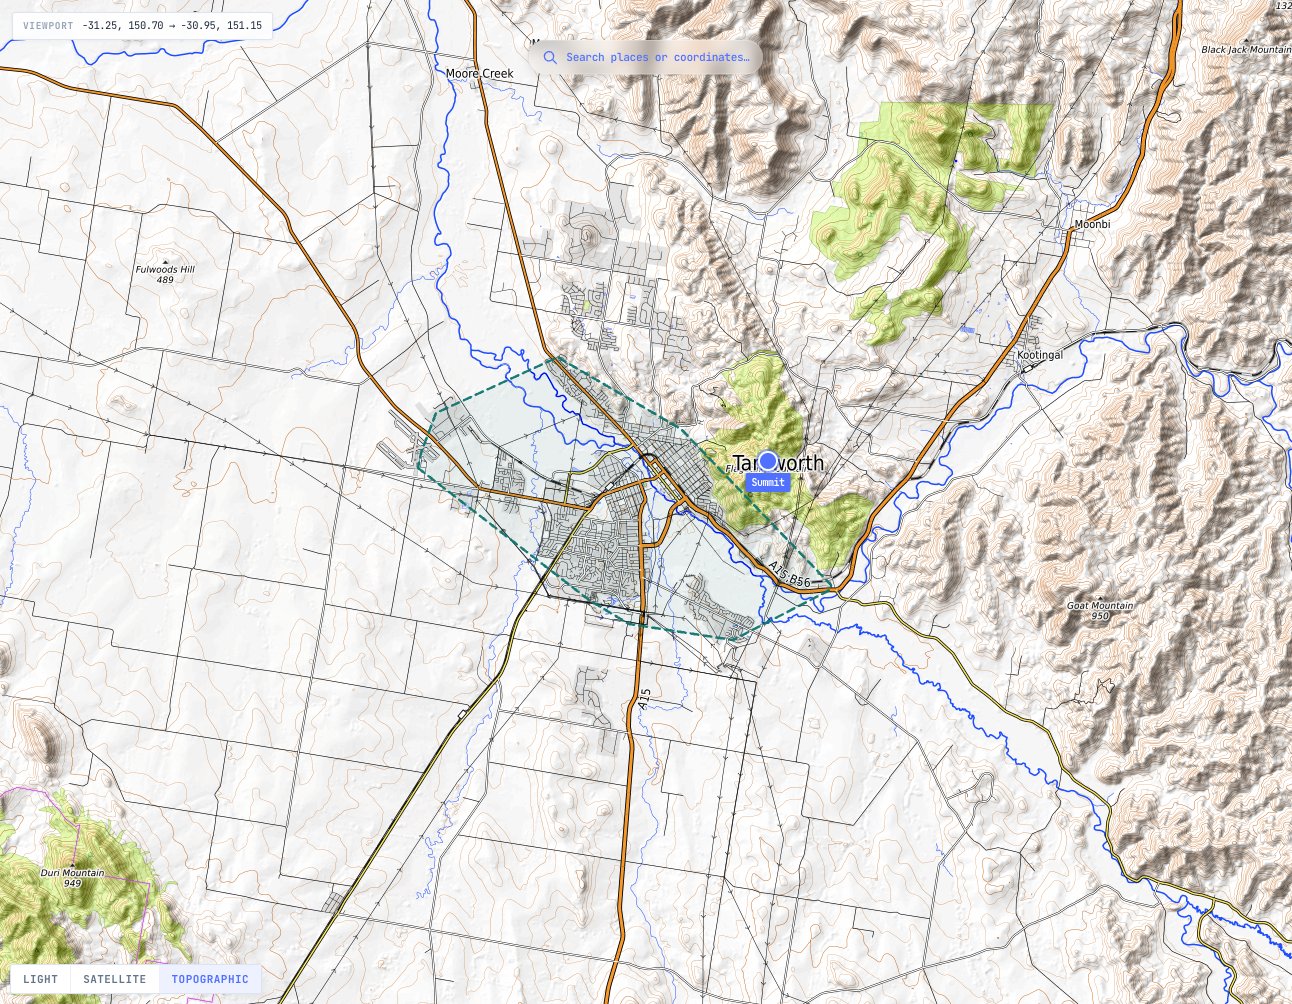
Tamworth sits on the plains of the Peel River, at about 384 m above sea level in the city centre. A ridge rises straight out of the eastern edge of the city to 833 m, about 3.5 km from the centre. That ridge is the obvious place for a repeater.
The users are outdoor crews working across the city with handheld radios. We drew the service area as the city’s built-up land, traced from ESA WorldCover land cover, which covers 66.6 km². The summit site is at -31.0859, 150.9669, so you can build the same project yourself.
Step 1: Set the Requirement
Start with the people, not the repeater. The requirement for this example is:
- The radio: a 5 W DMR handheld, the Kenwood NX-1300.
- Where it is worn: on the belt, outdoors. At 465 MHz a handheld at the waist loses 13.1 dB to the wearer’s body, against about 4.7 dB held at the face, from ITU-R P.1406-2. Design for the way people actually carry the radio.
- Audio quality: DAQ 3.4, which TIA TSB-88-B Table 1 describes as speech understandable with repetition only rarely required.
- Location reliability: 90 % of locations within each part of the map.
- Area: 90 % of the city in both directions. TSB-88-B §5.6 recommends 90 % of the area for land mobile systems other than public safety, and 97 % for public safety.
TSB-88-B also says a design should support the lowest-powered radio the users depend on. Here that is the handheld, so the handheld sets every number that follows.
Step 2: Choose the Site
A repeater’s range comes from the height of its antenna above the ground it serves, not the height of its mast. The summit of the ridge puts a 30 m mast about 480 m above the city centre, so it is the first candidate. Place a site there, give it the tallest antenna height the structure allows, and the tool takes the ground height from the terrain data.
Keep a second candidate in mind. As Step 9 shows, the highest point on a hill is not always the one that can see the area you need.
Step 3: Pick the Frequency Pair and Duplexer
A repeater transmits and receives at the same time, so it needs two frequencies and a duplexer to share one antenna between them. The split between the two comes from the band plan. In Australia the 400 MHz land mobile plan is RALI MS 22, which pairs base transmit channels from 462.5 to 467.5 MHz with base receive channels 10 MHz lower.
For this example we used 465.0125 MHz for the repeater’s transmitter and 455.0125 MHz for its receiver, with 12.5 kHz DMR channels. This is an example pair, not an assignment.
The duplexer has to isolate the repeater’s receiver from its own transmitter. We chose a Telewave TPRD-4544 from the catalogue: 400 to 470 MHz, rated at 250 W, with 1.0 dB of insertion loss and 75 dB of isolation at 5 MHz separation. A 10 MHz split is comfortably wider than that. Our guide to duplexers, cavity filters and combiners explains why isolation figures only mean something against a stated separation.
Step 4: Build the Transmit Chain
Every decibel between the repeater and the antenna is lost in both directions, so count them carefully.
For the first attempt:
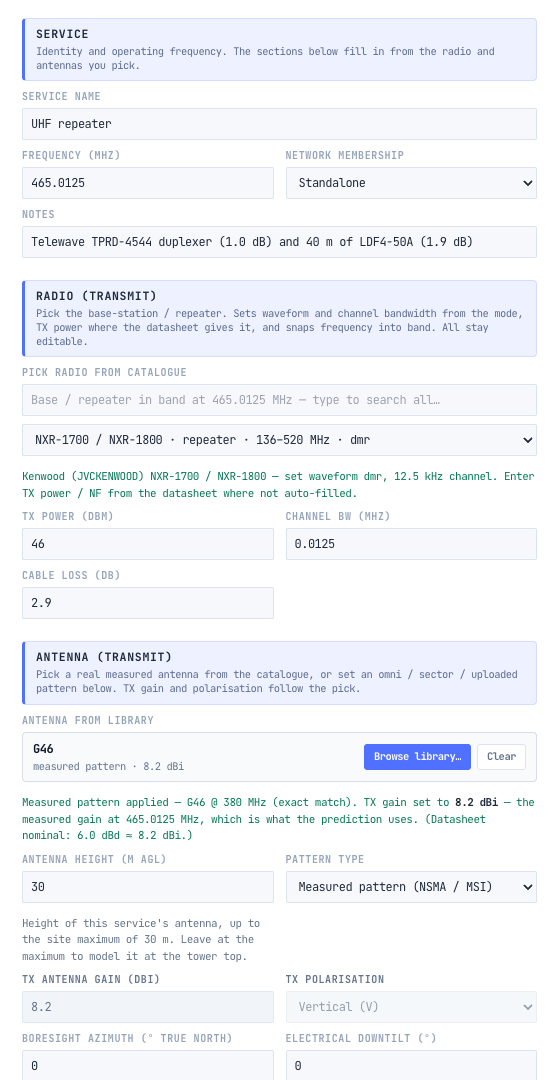
- Repeater: a Kenwood NXR-1800 at 40 W, which is 46 dBm. It is an example, not a recommendation.
- Duplexer: 1.0 dB.
- Feeder: 40 m of CommScope LDF4-50A half-inch cable, which loses 4.75 dB per 100 m at 450 MHz in the catalogue data, so 1.9 dB.
- Line loss: 1.0 + 1.9 = 2.9 dB, entered once for transmit and once for receive.
- Antenna: a ZCG G46 omnidirectional collinear with 8.15 dBi (6 dBd) of gain.
- EIRP: 46 dBm - 2.9 dB + 8.15 dBi = 51.3 dBm.
The Cable Loss Calculator works out feeder loss for any cable and length, and our guide to EIRP and ERP covers the conversion if a licence quotes ERP.
Step 5: Choose the Antenna by Its Vertical Pattern
Gain is not free. An omnidirectional collinear gets its gain by squeezing the beam vertically, so a higher-gain antenna radiates less energy above and below the horizon.
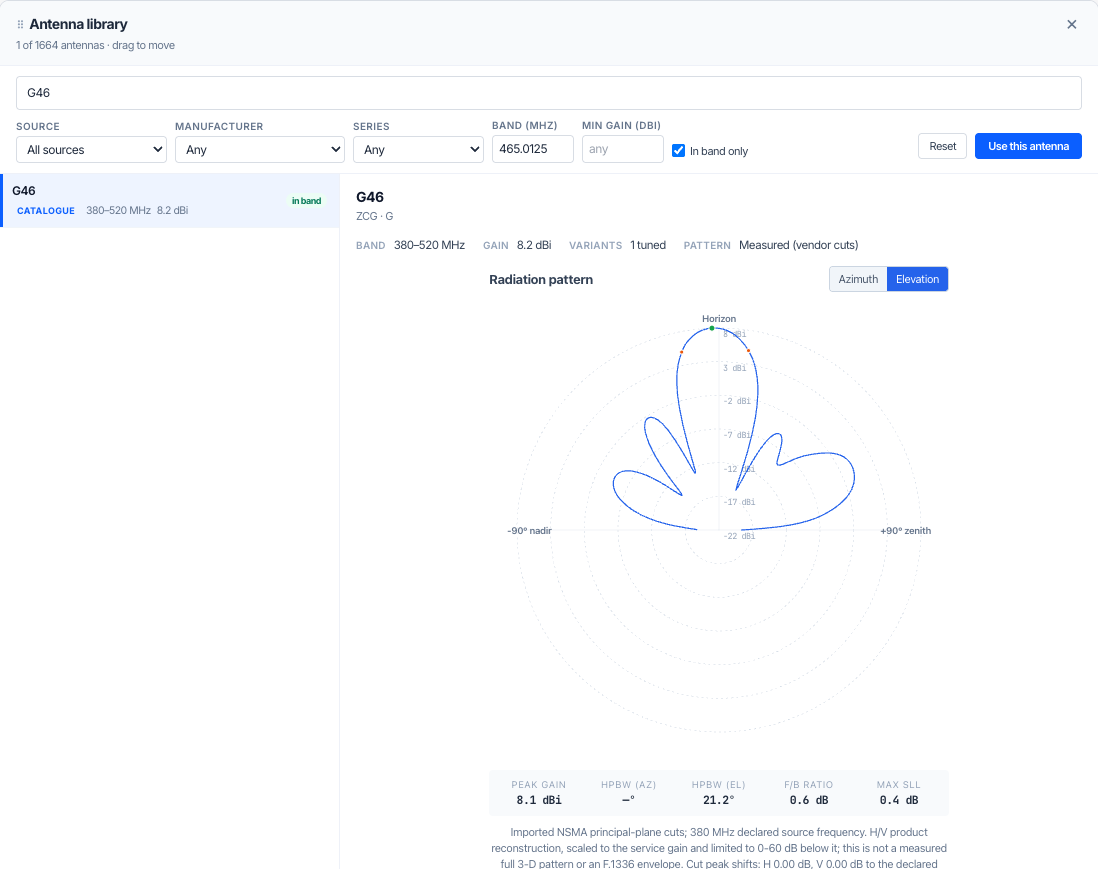
On a hill this matters. From the summit, the city centre is about 7.5° below the horizontal. That is inside the G46’s 21.2° beam but outside the half-power beam of the G49, whose datasheet gives a vertical beamwidth of about 12°. A higher-gain antenna reaches further across the plains and can do worse right under the hill. The tool uses each antenna’s measured pattern in both planes, so the prediction shows this rather than assuming the full gain everywhere. Our guide to antenna gain, beamwidth and radiation patterns covers the trade in more depth.
Step 6: Set the Receiver and the Coverage Threshold
The coverage threshold is the weakest signal at which the radio still gives the audio quality you asked for. It is the single most important number in the design.
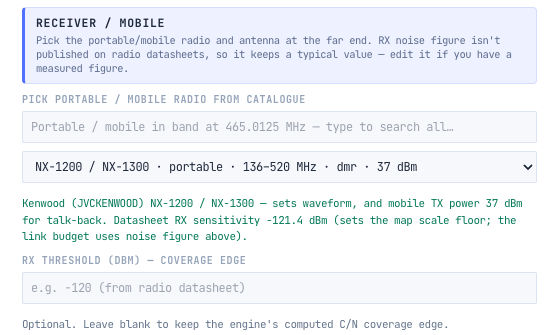
When we picked the NX-1300, the tool filled in its datasheet sensitivity of -121.4 dBm as the coverage edge. That figure is a bench measurement on a steady signal. A handheld moving through a city sees a fading signal, and it needs more to sound good.
With the field cleared, the tool builds the threshold from the noise in the channel and the carrier-to-noise ratio the radio needs for DAQ 3.4 in fading:
- Thermal noise in 12.5 kHz: -174 dBm/Hz + 10 log(12 500 Hz) = -133.0 dBm.
- Receiver noise figure: 7 dB, an assumption because radio datasheets do not publish it.
- Required C/N for DAQ 3.4: 13.1 dB. TSB-88-B Table A-1 has no row for DMR, so the tool uses Tait’s published figure of 15 dB in 8 kHz, which includes Rayleigh fading, and converts it to the 12.5 kHz noise bandwidth: 15 - 10 log(12.5 / 8) = 13.1 dB.
- Threshold: -133.0 + 7 + 13.1 = -112.9 dBm, which the tool carries to more decimals as -113.0 dBm.
That is 8.4 dB above the datasheet sensitivity. Designing to the datasheet figure would have painted a map 8.4 dB more generous than the radios deliver.
Step 7: Choose the Propagation Model
On automatic, the tool chose Hata-Okumura for this site, an empirical model fitted to measurements around Tokyo. Its run notes say what it took as the base station height: the 30 m mast above the ground, not the site’s height above the city, with terrain diffraction added separately.
For a site 450 m above the area it serves we set the model to ITU-R P.1812-8, which follows the actual terrain profile from the site to every point on the map. We left OSM buildings off. The tool still applies land cover clutter from ESA WorldCover, and the prediction uses the P.1812-8 location variability to set the 90 % location reliability.
Our guide to RF coverage prediction, terrain, antenna height and clutter explains model choice in more depth.
Step 8: Predict Both Directions
A repeater system has two links: talk-out, from the repeater to the radio, and talk-back (sometimes called talk-in), from the radio to the repeater. The coverage that matters is where both work.
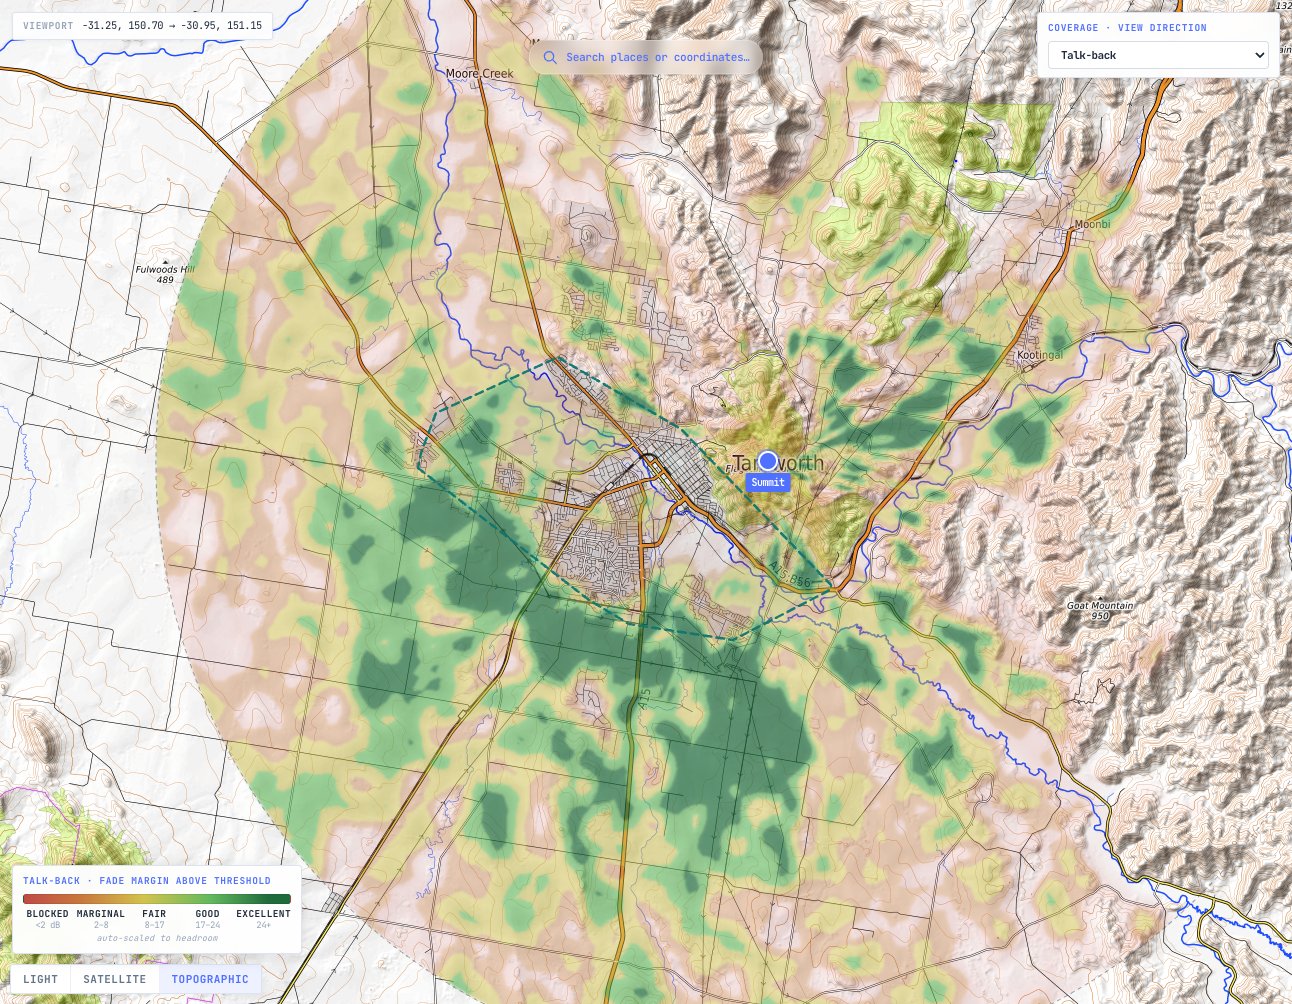
From the summit with the G46, across the city:
- Talk-out: 96.9 % covered.
- Talk-back: 73.5 % covered.
- Both directions: 73.5 %, so the design fails the 90 % target.
You can check the imbalance by hand. Taking the most path loss each direction can tolerate before location variability:
- Talk-out: 51.3 dBm EIRP - 13.1 dB body loss + 0 dBi handheld antenna + 113.0 dB (the threshold) = 151.2 dB.
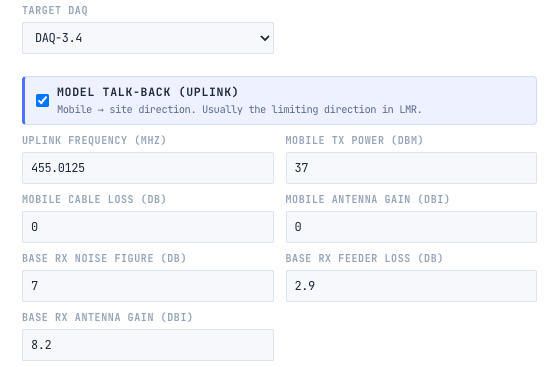
- Talk-back: 37 dBm - 13.0 dB body loss at 455 MHz + 8.15 dBi - 2.9 dB line loss + 113.0 dB = 142.3 dB.
Talk-back has 8.9 dB less to work with, almost exactly the difference between the repeater’s 40 W and the handheld’s 5 W. Everything else is the same in both directions. This is why talk-back is usually the limiting direction for handhelds, and why a map of talk-out alone flatters a design. Our guide to calculating an RF link budget explains each term.
Step 9: Find the Cause and Fix It
The talk-back map shows something unexpected. The suburbs on the plains, 5 to 10 km away, are fine. The city centre, 3.6 km from the site and 450 m below it, is the weakest part of the city.
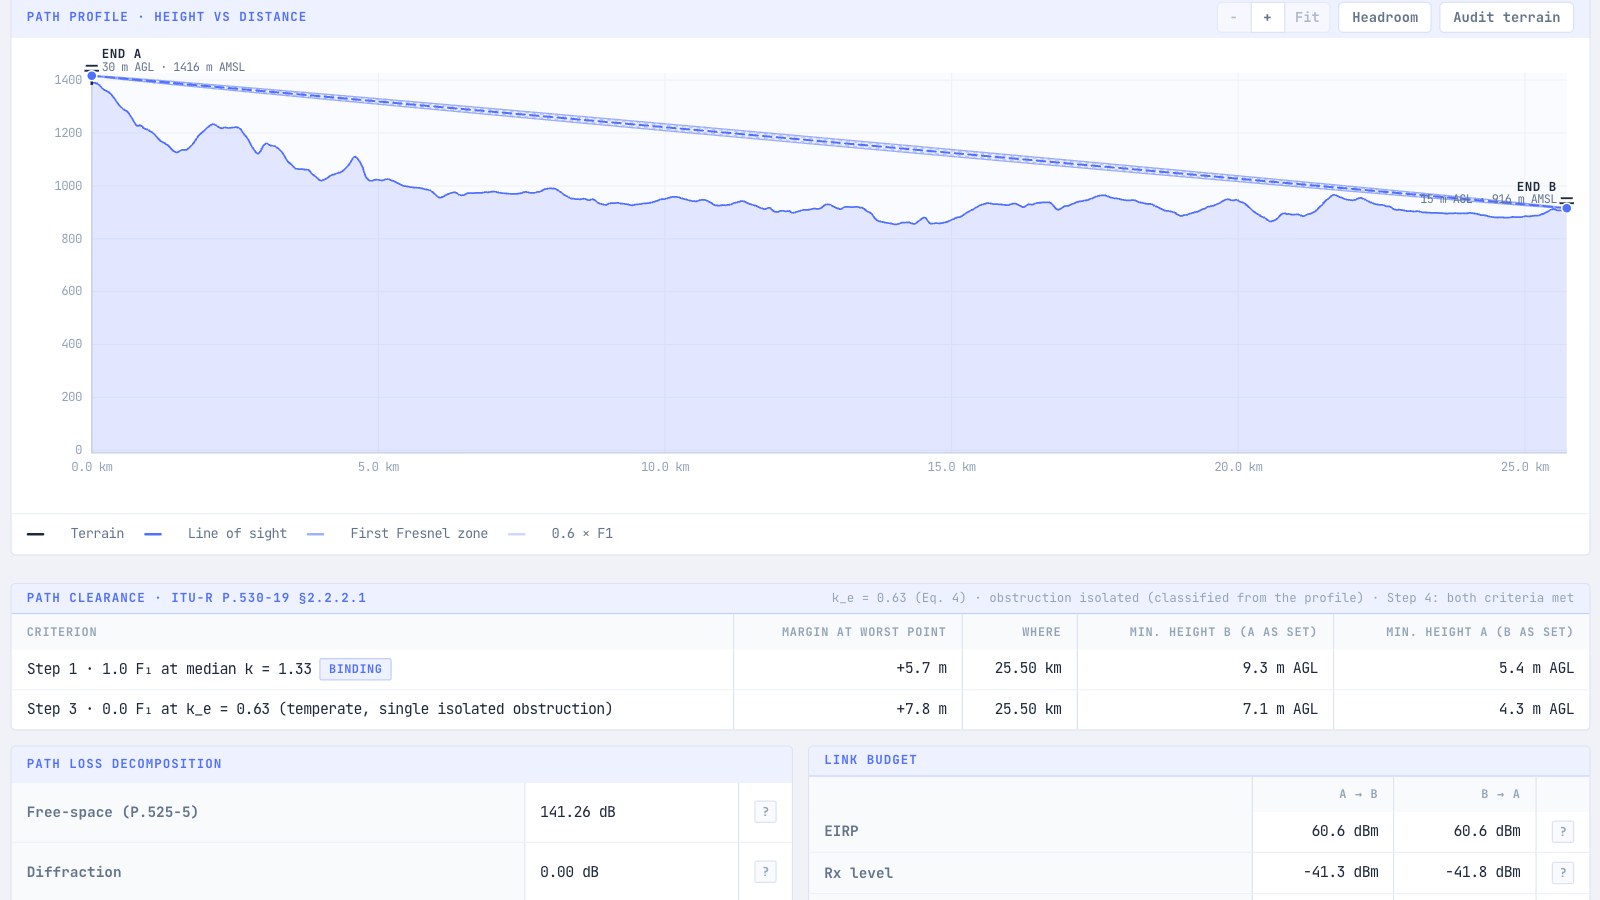
The path profile shows why.
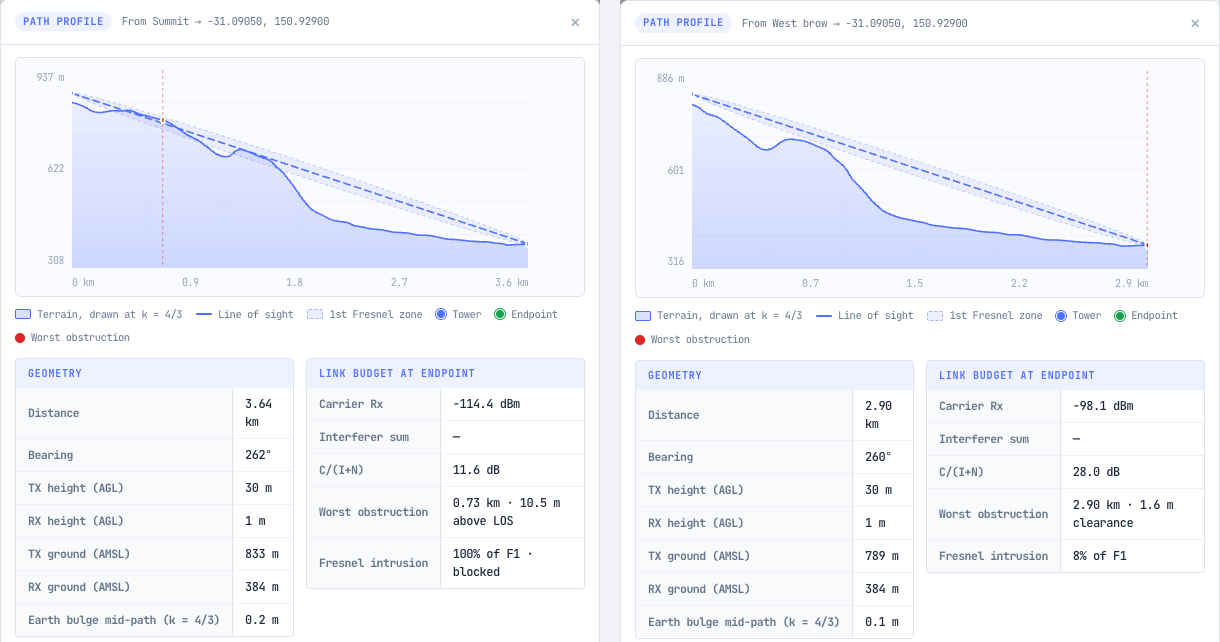
From the summit, the path to the city centre crosses the rounded shoulder of the ridge 0.73 km from the mast. The shoulder sits 10.5 m above the line of sight and blocks the whole first Fresnel zone. The handheld there receives the repeater at -114.4 dBm, 1.4 dB below the threshold, and the return path is weaker again.
This is a common trap with hill sites. A mast on the middle of a broad, rounded summit looks out over the horizon, but the hill’s own slopes hide the ground close to its foot.
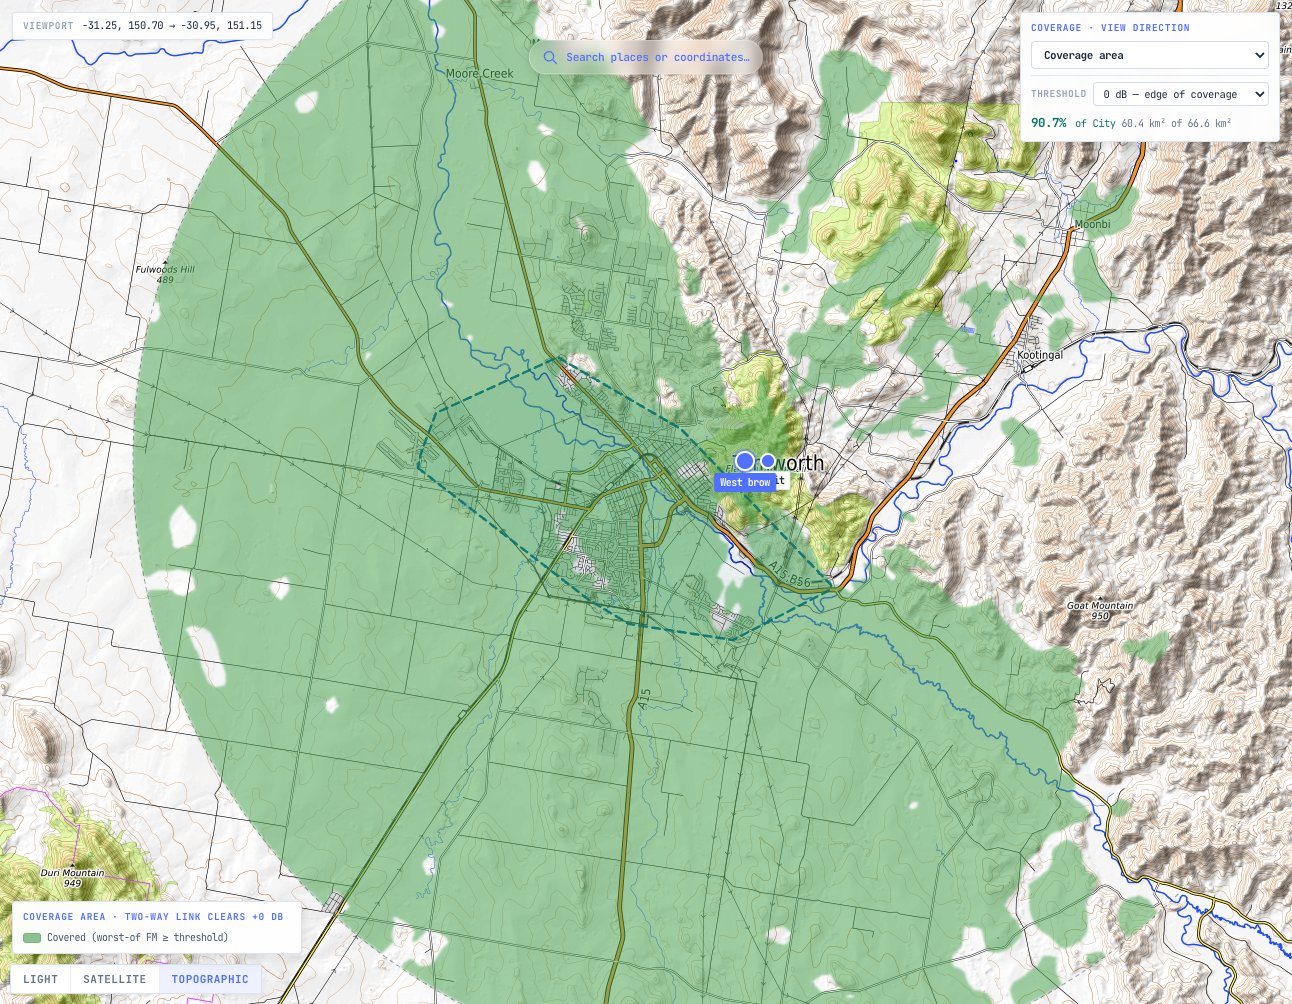
The fix is to move the site to the brow, the edge of the summit facing the city. We placed a second site 750 m west along the ridge, at 789 m, still with a 30 m mast. From there the path to the same point clears the slope, and the received level rises to -98.1 dBm, 16.3 dB better.
Then we tried each change separately and together. The table gives the share of the city covered in both directions, from four runs of the same project:
| ZCG G46, 8.15 dBi | ZCG G49, 11.15 dBi | |
|---|---|---|
| Summit | 73.5 % | 81.0 % |
| West brow | 86.0 % | 90.7 % |
Neither change is enough on its own. The brow site and the higher-gain antenna together meet the 90 % target. Talk-out across the city rises to 99.2 %.
Step 10: Check the Wider Area
Moving the site has a cost. The brow sits on the western side of the summit, so the summit now shadows the valleys to the east. Across a 15 km circle around the city, handheld coverage in both directions falls from 80.5 % from the summit to 73.1 % from the brow, both with the G49.
Whether that matters depends on the requirement. If crews only work on foot in the city, the brow is the right site. If they also drive the district, check the radio they use there. With vehicle radios on 3 dBi roof antennas, the same brow site covers 99.5 % of the district in both directions at 25 W, and 96.3 % at 5 W. A vehicle radio has no body loss, so even at 5 W it has 15.5 dB more to work with than a handheld on the belt. TSB-88-B §5.6 advises systems built around handhelds not to let mobiles run at powers far above the handheld design level, so set mobile power to suit rather than to the maximum.
If handhelds must also work in the eastern valleys, the usual answers are a receive-only voting site that covers the shadow, which many repeaters support as an option, or a second repeater site. Both are a larger project, and both start with the same coverage study.
Capacity is a separate question from coverage. One DMR repeater carries two voice paths. Our guide to Erlang and sizing channels and repeaters shows how to check that it carries the traffic.
Step 11: Plan the Licence and Export the Design
In Australia a land mobile repeater needs an apparatus licence, and the frequency pair is assigned by the ACMA or by an accredited person after checking the services already nearby. This example has no regulator set. An Australian project can be switched to ACMA in Project settings, which adds the register and a licensing pre-check. A pre-check helps prepare the application; it is not the assignment itself. Our guide on how to get a radio licence in Australia explains the process.
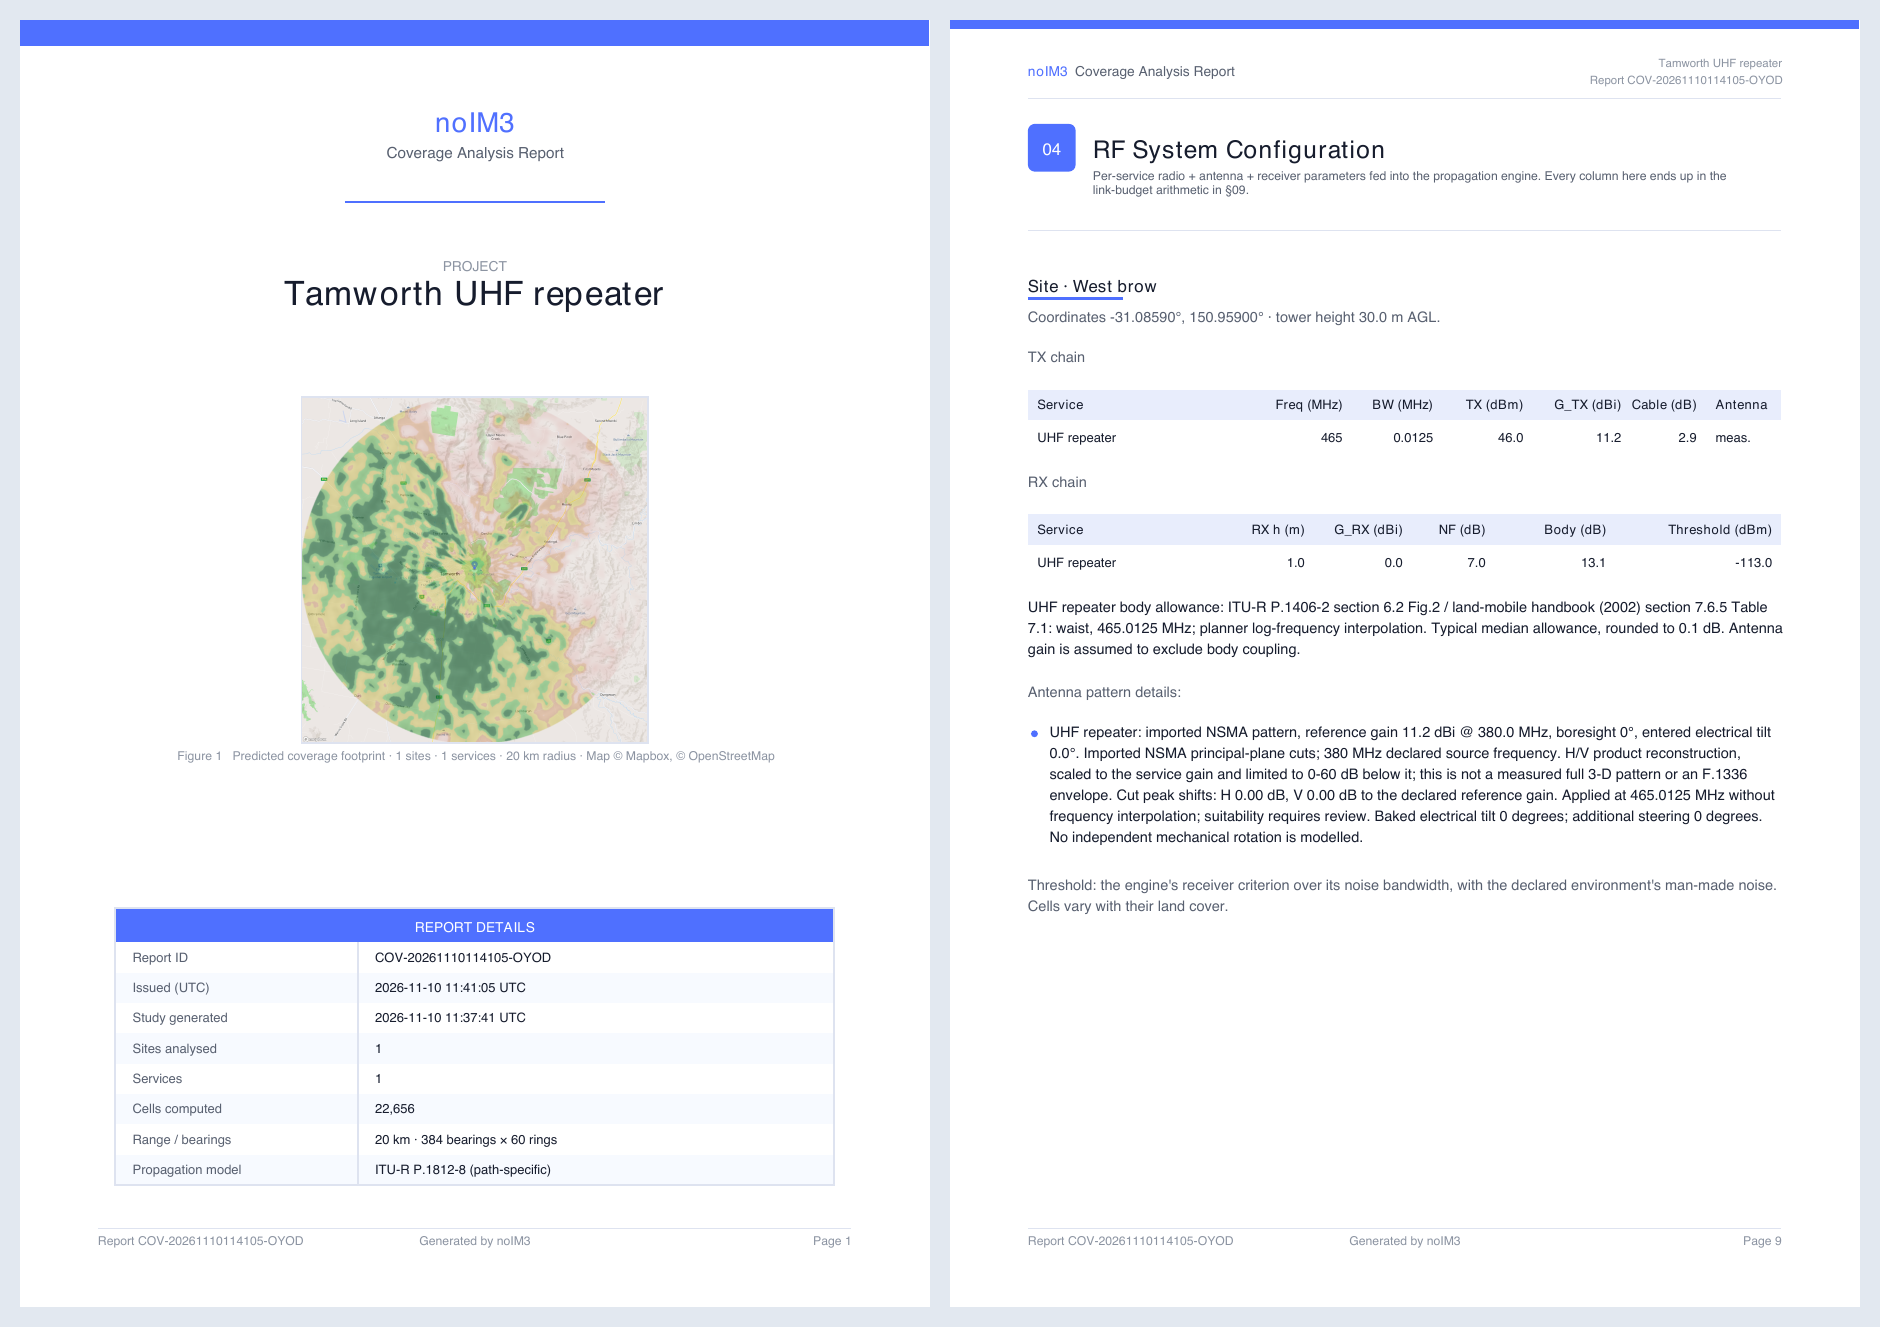
The Export rail turns the study into documents. The PDF report covers the sites, the RF configuration, the propagation model and every assumption, coverage statistics, heatmaps, and worked link budgets for representative cells. The same study exports to KML, KMZ, GeoTIFF, GeoJSON, contours and shapefiles for GIS.
A prediction is not a survey. Before committing to a site, visit it, confirm what is on the brow and around it, and plan a drive test once the repeater is on air. The tool can load drive test results against the prediction.
Common Mistakes When Designing a UHF Repeater
- Judging the design on talk-out. The repeater usually transmits at several times the power of a handheld. The coverage the users get is where talk-back also works.
- Designing to datasheet sensitivity. In this example the datasheet figure was 8.4 dB more generous than the threshold for DAQ 3.4 in fading.
- Ignoring where the radio is worn. A handheld on the belt loses about 8 dB more at UHF than one held at the face.
- Putting the mast on the highest point. On a broad, rounded hill the slopes can hide the ground right below the site. The brow facing the area often covers it better.
- Buying the highest-gain antenna. A narrow vertical beam can overshoot users close to a high site.
- Using a model that ignores the terrain. An empirical model that sees only the mast height above ground misses what a hill site is for.
Frequently Asked Questions
How far can a UHF repeater reach?
It depends on the height of the antenna above the area, the terrain, the radios and the audio quality required. In this example a 30 m mast on a ridge 400 m above a city gave handhelds on the belt 90.7 % of a 66.6 km² city in both directions, while 25 W vehicle radios reached 99.5 % of a circle 15 km around the city. A coverage prediction for the actual site is the only reliable answer.
Why can I hear the repeater but it cannot hear me?
Because the repeater transmits with more power than your radio. A 40 W repeater against a 5 W handheld is a 9 dB difference, and in this example talk-back had 8.9 dB less to work with than talk-out. Design the system on talk-back, or improve the repeater’s receive side, so the two directions match.
What does a duplexer do in a repeater?
It lets the repeater transmit and receive at the same time on one antenna. It passes the transmit frequency to the antenna, passes the receive frequency to the receiver, and stops the transmitter’s power and noise from desensitising the receiver. The frequency split sets how much isolation it can give.
Is a higher-gain antenna always better on a repeater?
No. A higher-gain omnidirectional antenna has a narrower vertical beam. From a high site, users close to the hill can fall below that beam. In this example the 11.15 dBi antenna improved two-way coverage overall, but it slightly reduced talk-out in the city when mounted on the summit.
What is a good coverage target for a two-way radio system?
TIA TSB-88-B §5.6 recommends that the channel performance criterion, the audio quality target, be met over 90 % of the service area for land mobile systems other than public safety, and over 97 % for public safety. DAQ 3 is the usual audio quality target and DAQ 3.4 a stricter one.
Do I need a licence for a UHF repeater in Australia?
Yes. A land mobile repeater operates under an apparatus licence, and the frequencies come from the ACMA band plans, such as RALI MS 22 for the 400 MHz band. UHF CB repeaters are a different service: they use dedicated CB channels under the CB class licence and are shared with the public.
Design Your Own Repeater
The Coverage Predictor runs every step in this guide on your own sites: catalogue repeaters, handhelds and measured antenna patterns, talk-out and talk-back at their own frequencies, ITU-R P.1812-8 terrain prediction, path profiles, study areas with a covered percentage, and a full PDF report. It is part of noIM₃ Pro, and new accounts start with a free 14-day Pro trial.
For single checks, the free Link Budget Calculator works through one path, and the RF Filter and Combining Designer helps plan the duplexer and filters at the site.
Notes on Sources
Every figure in the worked example comes from runs of the noIM₃ Coverage Predictor (build 1.64.3) on 10 November 2026. Terrain is Mapbox Terrain-RGB elevation data, and land cover and the city outline are from ESA WorldCover. OSM buildings were not used. The repeater, handheld, antenna, duplexer and cable values are from the noIM₃ catalogue, taken from the manufacturers’ published data. The radio noise figures (7 dB at both ends) are assumptions, as datasheets do not publish them. The frequency pair is an example, not an assignment. The example is a planning prediction, not a site survey, and it does not describe any existing installation. The EIRP, line loss and maximum path loss arithmetic are our own.
- ITU-R P.1812-8, A path-specific propagation prediction method for point-to-area terrestrial services in the frequency range 30 MHz to 6 000 MHz, for the coverage prediction and location variability.
- ITU-R P.1406-2, Propagation effects relating to terrestrial land mobile and broadcasting services in the VHF and UHF bands, §6.2 Fig. 2, for body loss at the waist and head.
- TIA TSB-88-B, Wireless Communications Systems: Performance in Noise and Interference-Limited Situations: Table 1 for delivered audio quality, and §5.6 for the 90 % and 97 % area recommendations and the advice on mobile power.
- Tait Communications, Comparing voice coverage: DMR and TETRA (2020), for the DMR carrier-to-noise figure at DAQ 3.4, used because TSB-88-B Table A-1 has no DMR row.
- ACMA RALI MS 22, 400 MHz band plan (17 January 2020), Table 1, for the base transmit and receive segments and the 10 MHz split.
- Map images: map data © OpenStreetMap contributors, SRTM; map style © OpenTopoMap (CC-BY-SA).